
There's still one more day left in the trading week for the bulls to get something going. But, after Thursday's close and headed into Friday's action, the bears still have control. In fact, the bulls failed at the one key place where they just couldn't afford to fail, boding poorly for hopes of a summertime recovery.
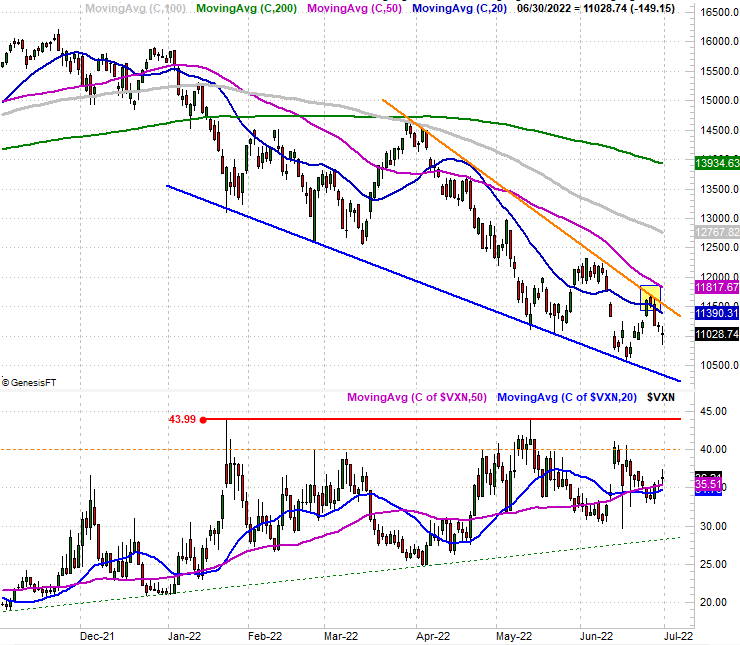
The technical ceilings in focus here were actually discussed in Sunday's Weekly Market Outlook. We mentioned then that the S&P 500 was about to test its 20-day moving average line (at 3930, then), while the Nasdaq Composite was within striking distance of a falling resistance line (at the time, right around 11.690) that had connected all the major peaks going back to March's high. Neither was hurdled. Both appear to have stood their ground as resistance, in fact.
Here's the Nasdaq's chart. The problem area is highlighted. The composite tested it, but once it was kissed, the index just rolled over.
Here's the S&P 500 with the same trouble area highlighted. The index only had to test the 20-day line for a couple of days before taking a decidedly-firm turn for the worst.
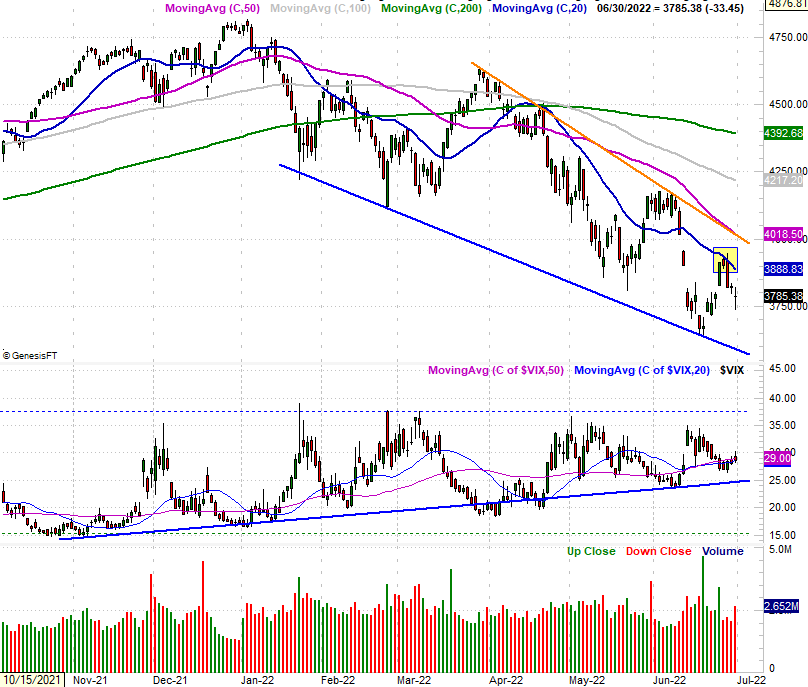
In both cases, the strength of the pullback on Tuesday -- following the bump into their respective technical ceilings -- is telling.
Yes, a lot of the recent bearish volatility can be chalked up to news headlines. Here's the thing.... the headlines don't necessarily steer stocks the way you think they would, and the way it seems they do. In a very similar sense, the market's movements not only dictate the tone of news but determine which news is featured and which is shoved to the proverbial back page.
That doesn't necessarily mean we should assume the market is doomed until it's clearly moving higher. Both of the indices, in fact, still have well-established support lines below them. In both cases though, the support, as well as resistance lines, are pointed lower, steering stocks in a bearish direction. It's been easier to make lower lows and lower highs than it's been to do the opposite. That's not unusual this time of year, but as a reminder, when the year starts off this bad, it tends to remain bad and continue to lose ground through September.
Also not that on both charts the indices' volatility indices are trapped between support and resistance lines as well... support and resistance that's converging. That convergence is going to force both sides of the market to show their hands sooner than later.
Whatever the case, we wanted to point this out headed into Friday's action just so you knew where the market was. It's not likely (although not impossible) the market will be able to gain enough ground on Friday to actually punch through the technical ceilings discussed above. And, it's even more unlikely either index will close out the week with a gain since both ended last week above where the aforementioned resistance lines lie. Most likely we'll end the week stuck squarely in the middle of narrowing trading ranges, which is more bearish than bullish.

Comments
Log in or sign up to join the conversation.