

Image Source: Unsplash
Yesterday was the first time ever that three U.S. companies ended the day with market caps of more than $3 trillion. Notably, the combined market cap of $9.2 trillion for the three largest stocks (MSFT, NVDA, AAPL) is roughly the same as the combined market cap of the smallest 350 stocks in the S&P 500.
Additionally, if all you own is an S&P 500 index fund, 20% of your portfolio is now in Microsoft (7.0%), Nvidia (6.7%) and Apple (6.3%). If you only own the Nasdaq 100 ETF (QQQ), 25% of your portfolio is in those three names. MSFT (8.5%), NVDA (8.2%) AAPL (8.1%). Are you diversified?
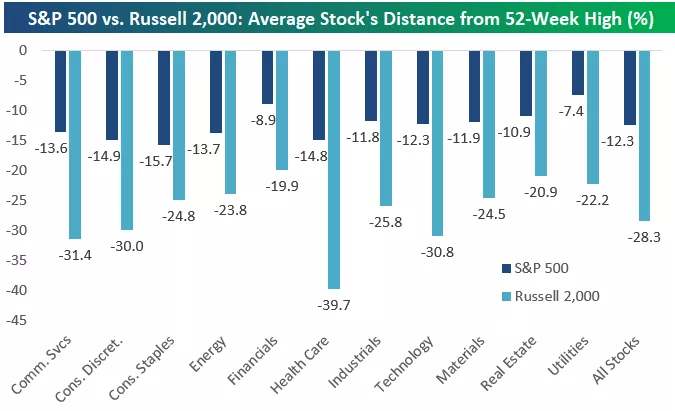
We'll leave you for the day with the chart below. As shown, within the S&P 500, the average stock is currently trading 12.3% below its 52-week high. That's pretty normal. Within the small-cap Russell 2,000, though, the average stock is 28.3% below its 52-week high.
Looking at just the Tech sector, the average Tech stock in the S&P 500 is 12.3% below its 52-week high, but the average Russell 2,000 Tech stock is more than 30% below its 52-week high.
This market looks MUCH different depending on whether you're focused mostly on large caps or small caps.
More By This Author:
Softening Indeed, Wednesday, June 5
EM Election Madness
Downward Debt


Comments
Log in or sign up to join the conversation.