Another CPI Spike… Now What?
As mentioned in today’s Morning Lineup, the consumer price index (CPI) rose 7.0% year over year in December, the highest rate of increase since 1982. Consumers across America are paying higher prices for everything from bread to gas due to supply chain constraints, labor shortages, easy fiscal and monetary policy, and robust demand. Although this number was in line with estimates, the y/y increase is certainly notable.

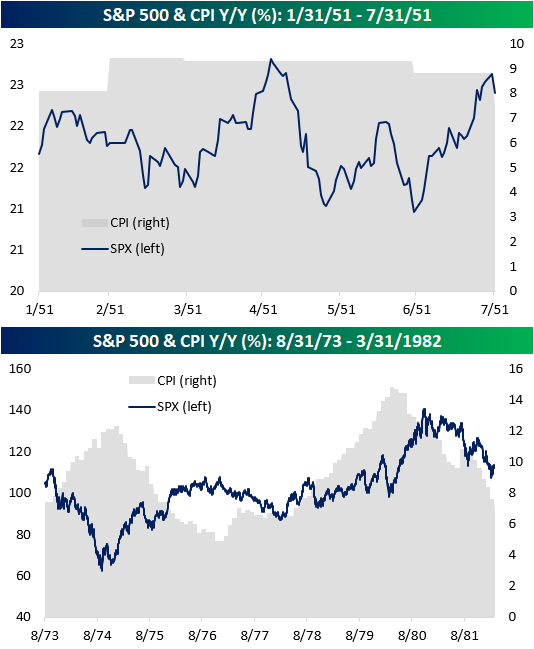
As shown in the chart above, there have only been four other periods since 1950 that y/y CPI reached 7.0% or more (1951, 1973, 1977, 1978), and in the table below we have summarized the performance of the S&P 500 during and after each of those prior periods. Overall, returns were mixed. In January 1951, the S&P 500 was just 0.4% off of its 52-week high when CPI first eclipsed 7%. During the seven months in which CPI remained above 7% on a y/y basis, stocks rallied 3.4%, and one year later, the S&P 500 was up 11.4%.
The longest streak of 7%+ y/y readings occurred between 1978 and 1982 and spanned 46 months. During this streak, the S&P 500 gained just 15.1% over the course of almost four years and just 1.8% in the year following the first reading over 7.0% in May 1978.
In between the 1951 and 1978 periods, there were two other occurrences where CPI eclipsed 7% on a y/y basis in 1973 (28 months) and 1977 (one month), and during both of these periods, equities traded lower.

As you can see from the charts below, the S&P 500 has acted differently each time CPI topped 7.0% on a Y/Y basis. In the first half of 1951, it appeared to trade independently of the elevated inflation readings, moving sideways as CPI readings remained elevated. For much of the 1970s, however, CPI and the S&P 500 tended to move in opposite directions. Nonetheless, much of the gains experienced in the ’70s were in periods when the rate at which prices were increasing was on the decline. Inflation has typically been considered a negative backdrop of equity prices but a key factor behind that performance is how long-lasting the inflation is. In the early 1950s, when the elevated level of inflation was short-lived, equities, which were already near 52-week highs, performed fine. In the 1970s, though, when inflation was more entrenched, the backdrop for equities was negative.