

Image Source: Pexels
Today is one of the enormous quarterly derivative expiration days where markets tend to see huge volume with a few oddities during the afternoon. I don’t see much else and I will touch on Thursday’s dramatic downside reversal on Monday.
Following up from yesterday’s somewhat negative bent on the stock market, I want to share three other charts which adds fuel to the fire.
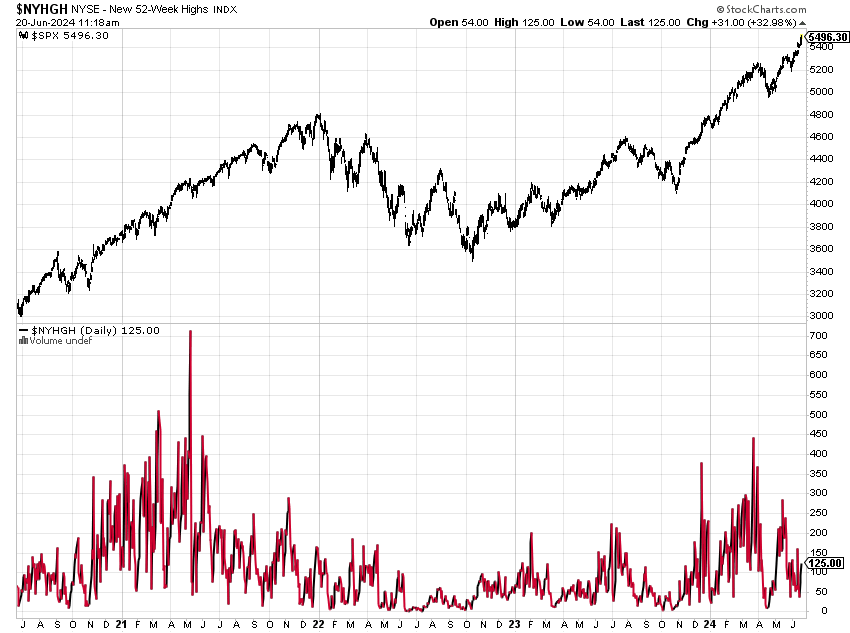
Below shows the S&P 500 on top with a chart of the 52-week highs below. You will notice that all quarter as the stock market has risen, the number of stocks making new highs has fallen to less than 50 at one point. This is not an all-out sell signal, but rather just a warning sign that the rally has narrowed. Of course, it can be repaired.
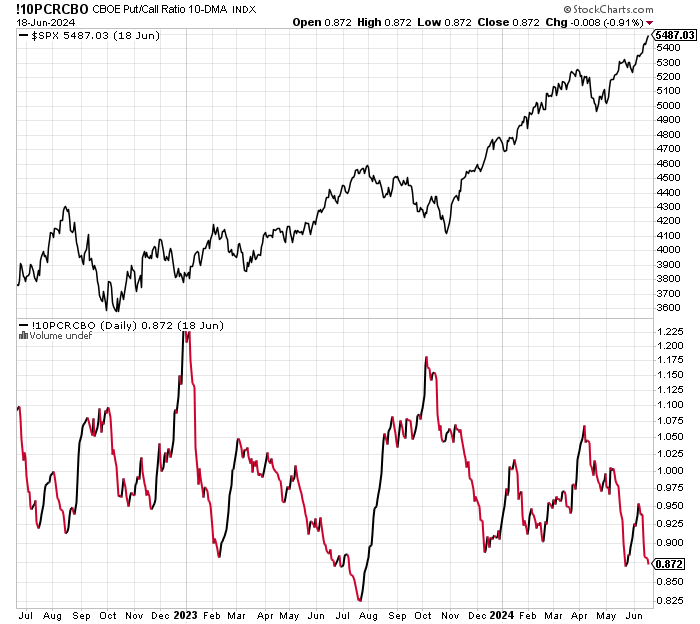
Next, let’s look at a 10-day average of options traders. Low readings indicate that traders are bullish on stocks and vice versa. While not as bad as last August before the 10% correction, options traders are nonetheless feeling pretty good now. Also not an outright sell signal but something to keep in mind.
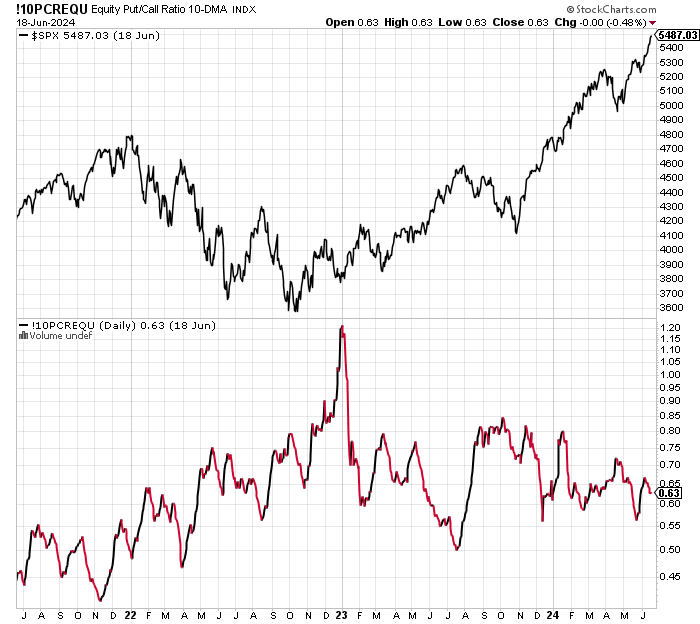
Finally, the below just focuses on options traders who only trade equity options and not indices. Their behavior isn’t as greedy as the chart above.
Summer arrived with some fury as the heat and humidity domed CT. After throwing a complete game last Sunday, D experienced another bout of elbow problems so he heads to the injured list. That means my weekend went baseball, baseball, baseball to essentially nothing.
On Thursday we bought levered S&P 500. We sold PCY, some QQQ and some SMPIX.
More By This Author:
Warning Signs Creeping Into The Stock MarketLooking At Yields Again
Fed Update – Cost Of Living Index At All-Time High – Dow To 50,000


Comments
Log in or sign up to join the conversation.