
Alaska Air ALK is a stock I have covered several times before and following last week’s price action it’s time to consider it once more and in particular on the daily timeframe, a chart that highlights the importance of levels and the opportunities this then presents for us as traders and investors.
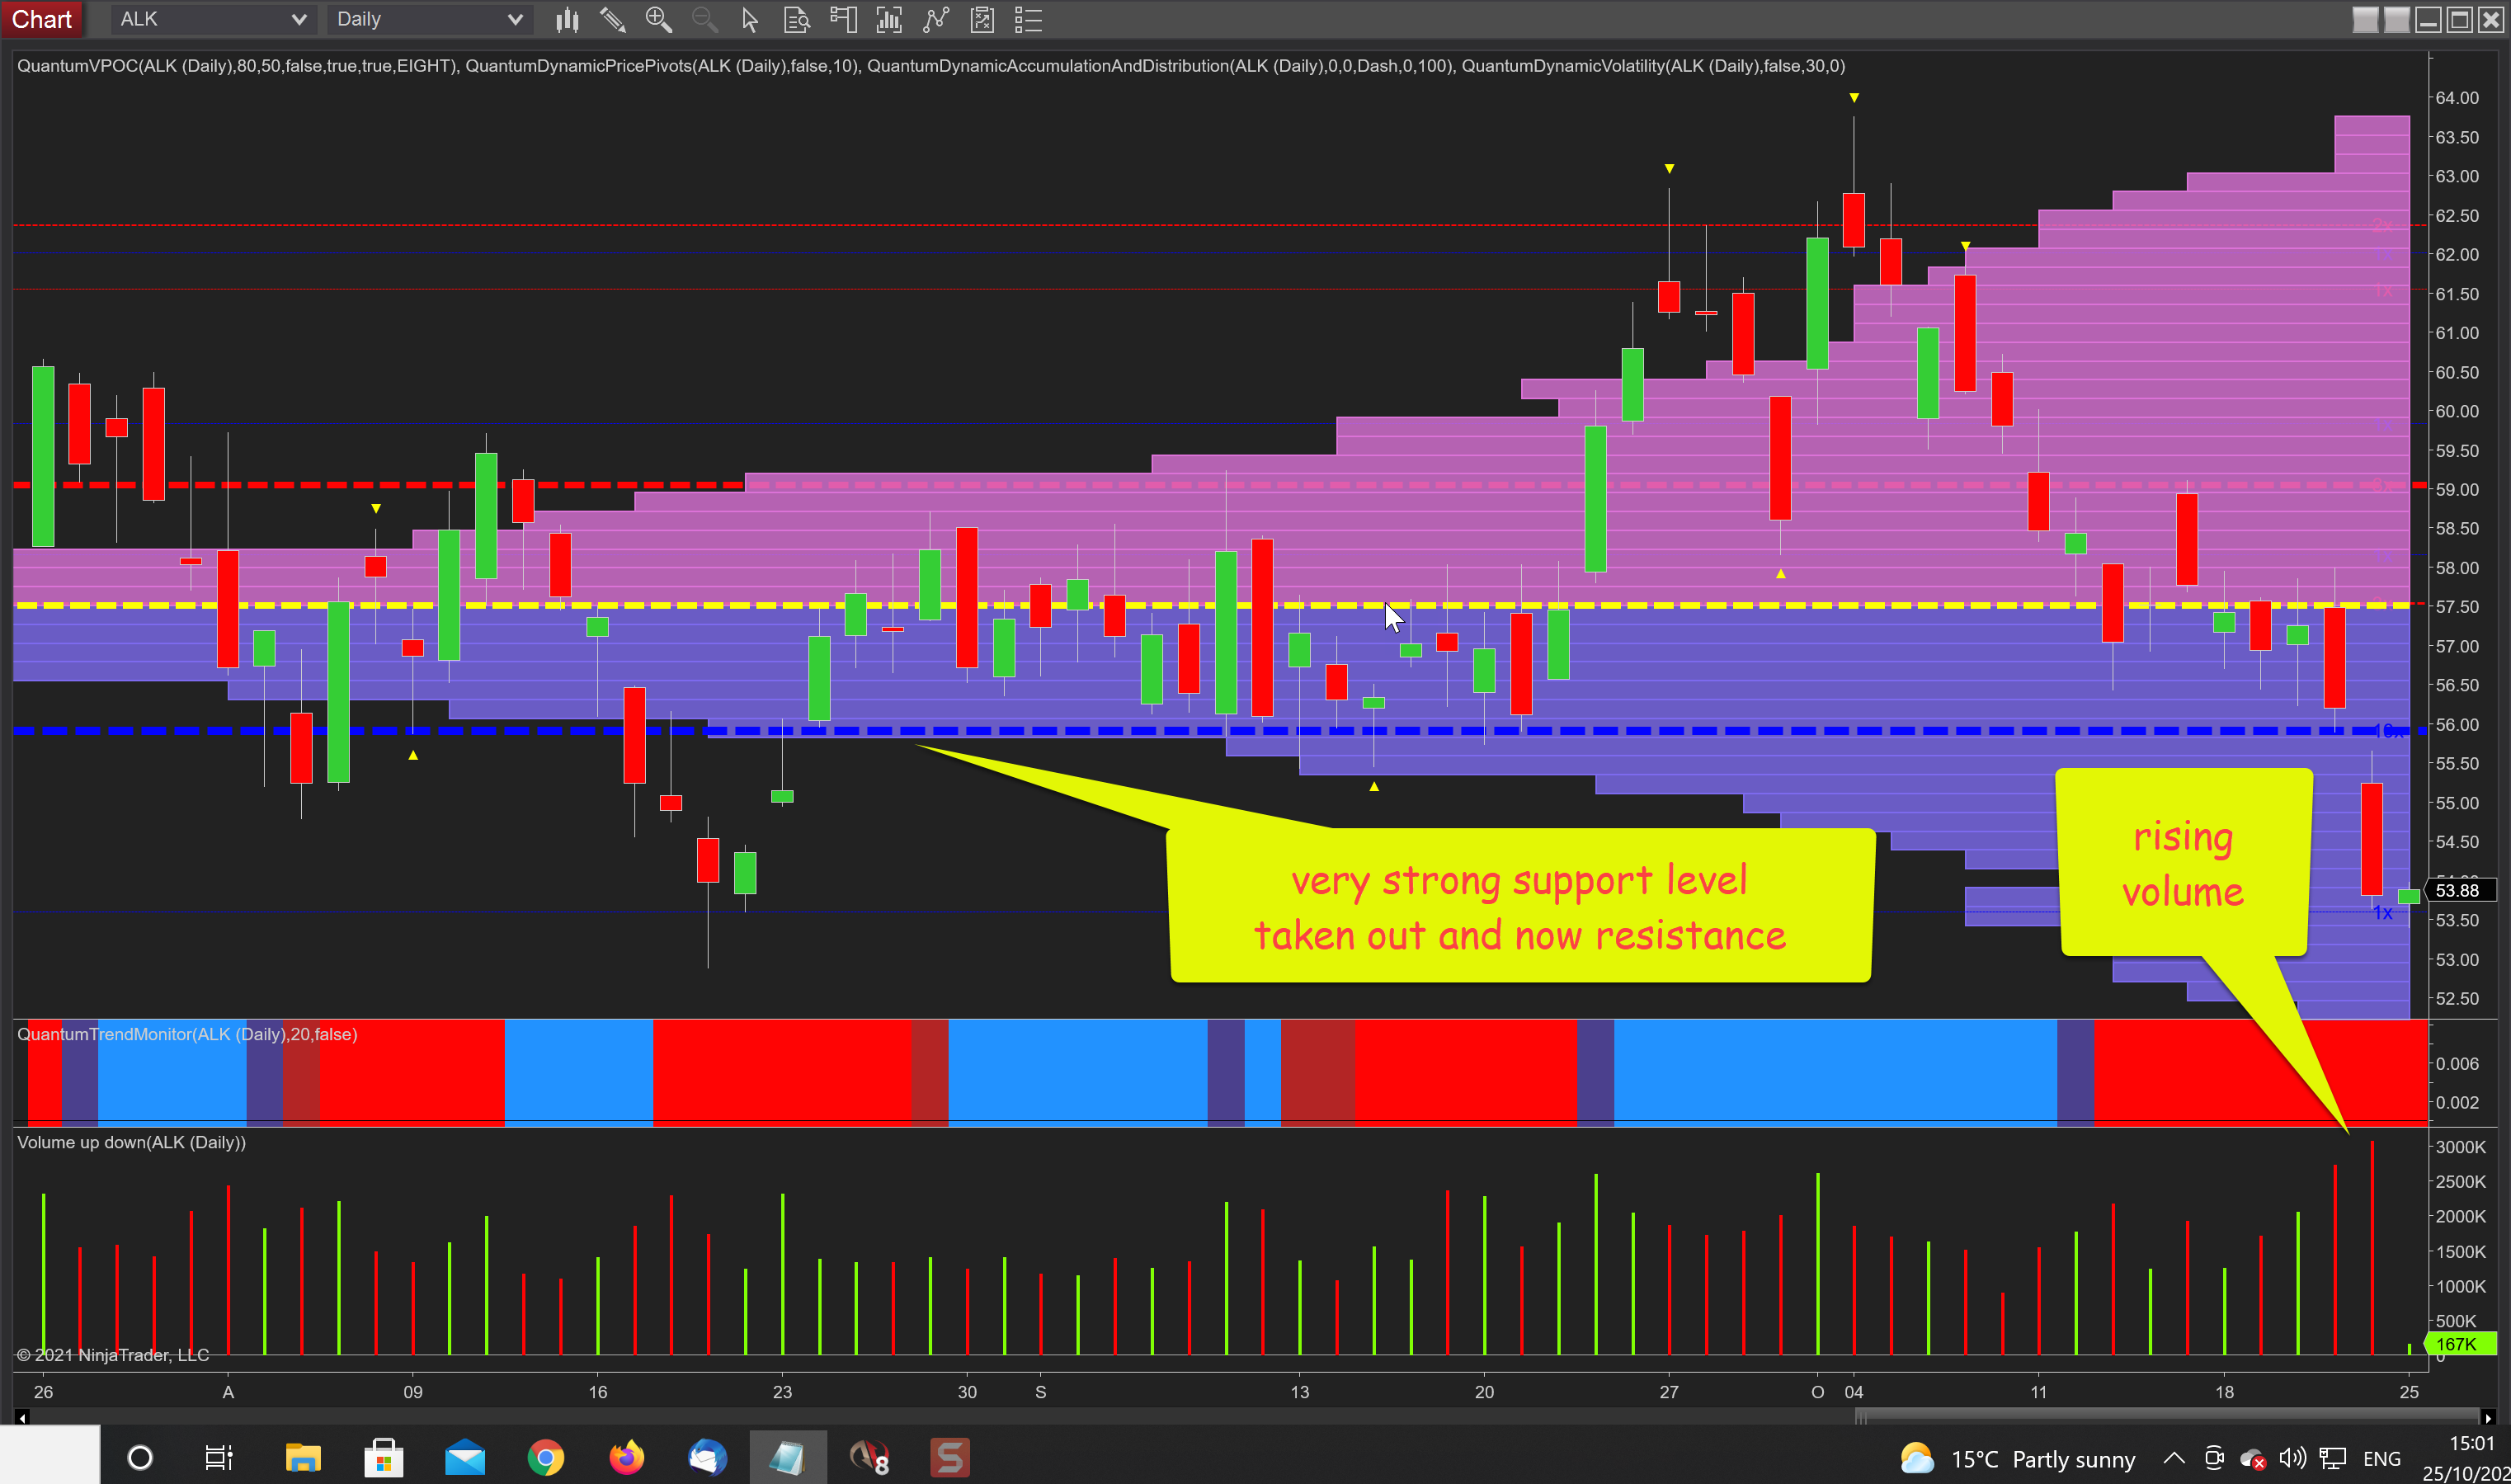
And the key level here is that denoted with the heavy blue dashed line of the accumulation and distribution indicator. The way this indicator for Ninjatrader and Tradingview works is to register each failed attempt at a breach of a level by thickening the line accordingly. So put simply, the wider the line, the stronger the level of support or resistance from a price-based perspective. In this case, the level had been tested on ten previous occasions and therefore extremely strong and until Thursday last week had held firm. But on Friday it was finally breached and now of course presents a formidable obstacle of resistance in the future with the price action closing on the last day of the week with a widespread down candle on rising volume and confirming the rising selling pressure for Alaska Air. With very little in the way of potential price-based support below, and with the volume falling away dramatically on the VPOC histogram there is also nothing in the way of volume-based support either. So, the prospect for Alaska Air looks bleak with the potential to fall towards $52 per share and possibly deeper still to $48 per share to test the lows of the start of the year.
(Click on image to enlarge)


Comments
Log in or sign up to join the conversation.