
We have been highlighting several market indicators trading at critical time/price areas over the past month or so.
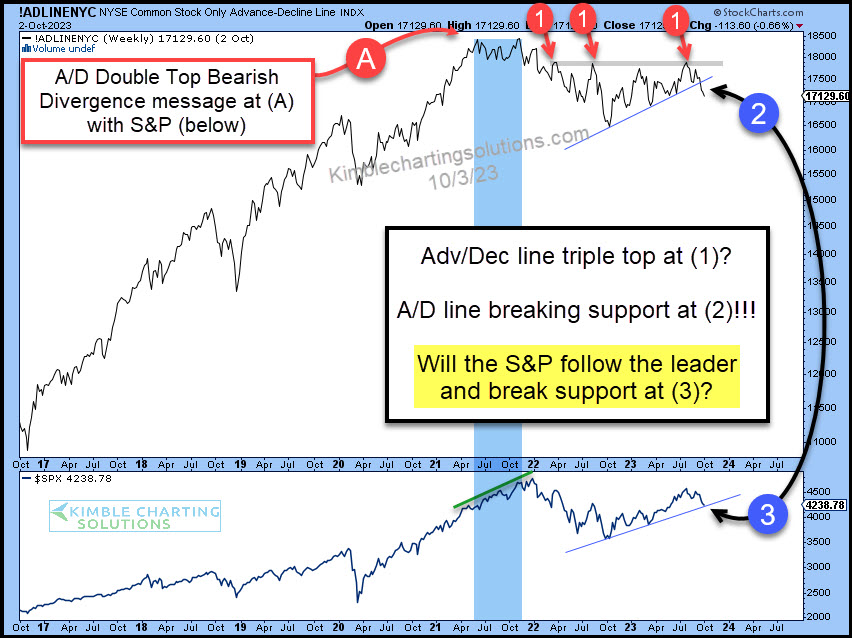
And today is no different as we take a look at the Advance/Decline Line for NYSE common stocks. This is a very important measure of market breadth looking at the number of advancing versus declining stocks each day.
As you can see in the chart below, the Advance/Decline Line (A/D Line) created a double top (blue shade) before creating a triple top at (1). And now it is breaking down below support at (2). Yikes!
Looking at the lower pane in the chart, I humbly ask, “will the S&P 500 follow the leading indicator and break support at (3)???
Could the A/D Line be sending a new message to the markets with its breakdown at (2)?
(Click on image to enlarge)
More By This Author:
Utilities Breaking Down: Omen For Stock Market And Economy?
Are Junk Bonds Sending Bearish Message To Stock Market?
$40 Billion In Wrong Bond Fund Past 2 Years, Says Joe Friday


Comments
Log in or sign up to join the conversation.