
In early September, we warned readers that Utilities were breaking down and that this would have an adverse effect on the stock market.
Since then, the breakdown has become more pronounced. And stocks have been under pressure.
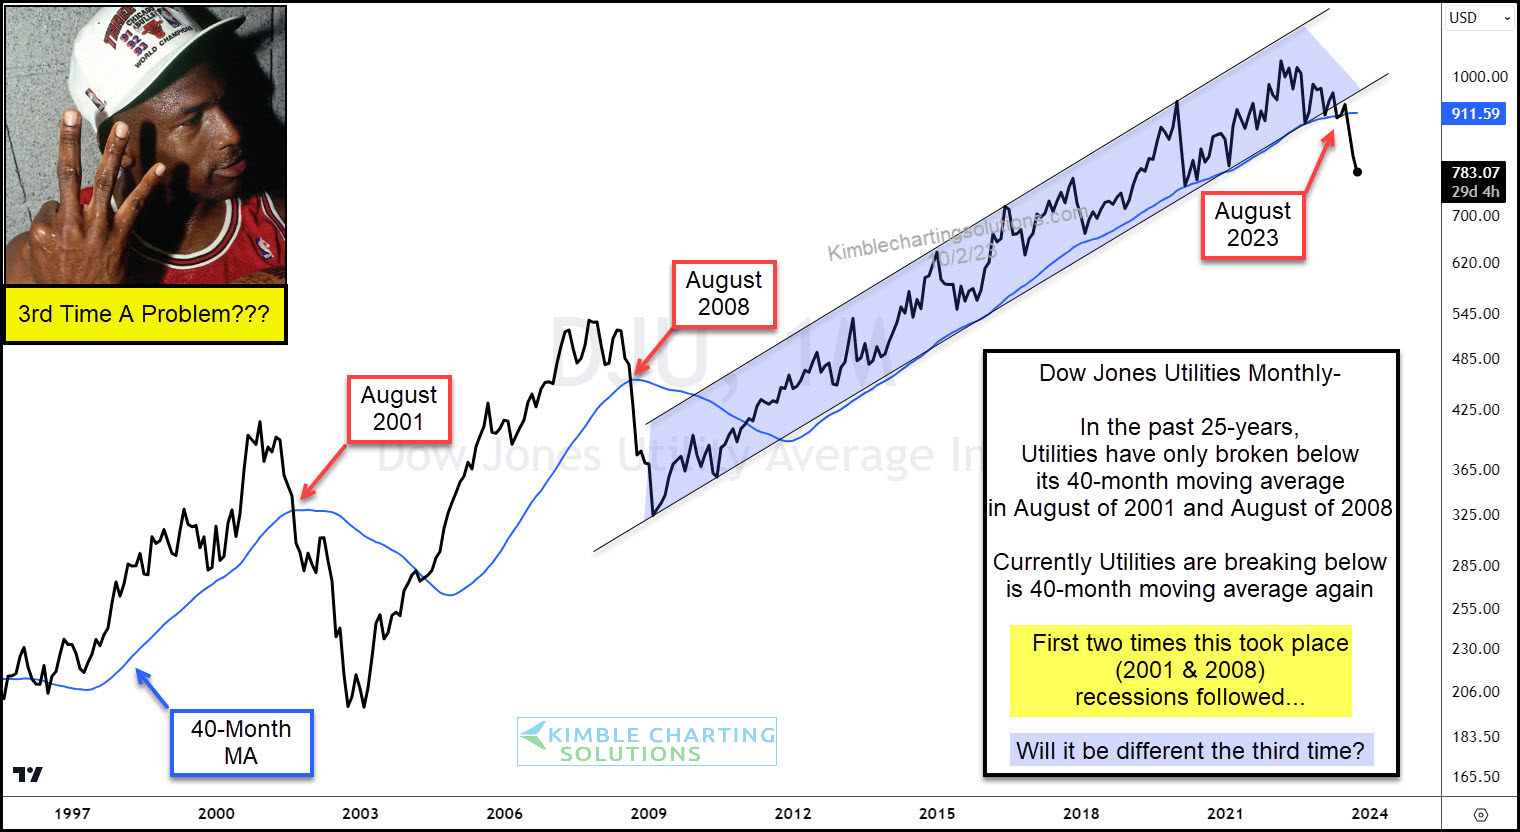
Today we provide an updated “monthly” chart of the Dow Jones Utilities Index, highlighting the clear breakdown below its uptrend line and 40-month moving average.
Historical Precedent
The Dow Jones Utilities Index has broken below its 40-month moving average only 2 times in the past 25 years. And both times recessions followed.
This marks the 3rd time in 25 years that Utilities have fallen below this moving average line…. different results this time?
(Click on image to enlarge)
More By This Author:
Are Junk Bonds Sending Bearish Message To Stock Market?
$40 Billion In Wrong Bond Fund Past 2 Years, Says Joe Friday
U.S. Dollar Double Top? Precious Metals Sure Hope So


Comments
Log in or sign up to join the conversation.