
A Tale Of Two Parabolic Markets
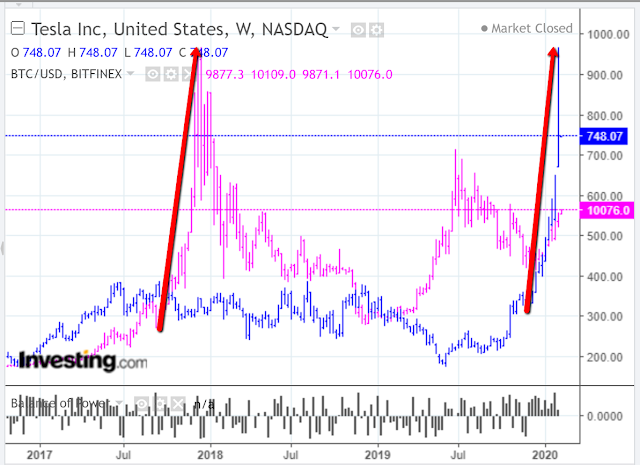
Check out the similar parabolic moves on Tesla (TSLA) and Bitcoin (BITCOMP) on the following weekly comparison chart.
Although both instruments are wildly different (inasmuch as Tesla is actually pegged to a tangible product and is backed by shareholders, Bitcoin is not...it's a cryptocurrency), they've both experienced extreme parabolic moves.
Bitcoin dropped like a stone throughout 2018 before it stabilized and eventually experienced a mini-rally (in comparison to its prior heady spike to 19,210 in 2017). Since mid-2019, it has mostly dropped in a choppy manner, and is attempting yet another comeback.
Tesla reached a high of 968.99 on February 4 before losing a couple of hundred points in two days. The Balance of Power is still in the hands of buyers on this timeframe. A drop and hold below zero will shift that power to sellers...one indicator to watch over the coming weeks.


#Tesla's move has largely been shorts having to cover. $TSLA