

Image Source: Pexels
Remember back in the day when Apple (AAPL) was the largest company in the world, and you would always hear the phrase, "As goes AAPL, so goes the market"? It was a comment that usually came from bears at times when AAPL’s stock was weak, and they used it as a justification for their bearish sentiment. Reality showed that while AAPL was a large share of the entire market, there were several times when the stock faltered, and the broader market remained strong, and vice versa.
AAPL is no longer the largest company in the world and now trails both Nvidia (NVDA) and Microsoft (MSFT) in terms of market cap, which further illustrates the point that the market can rally without AAPL. Just like with AAPL, the market can rally without NVDA and/or MSFT, too. It can also fall at times when those stocks rally. With a market cap of over $3 trillion, AAPL is still a significant part of the S&P 500, but the two can still move independently of each other. The last 12 months are a perfect example.
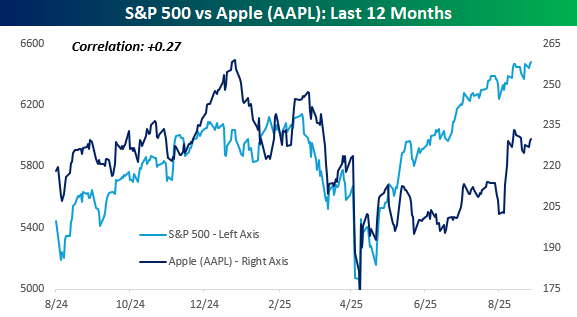
The chart below compares the performance of AAPL versus the S&P 500 over the last year. While the two traded in similar directions late last year, their paths haven’t been very similar in 2025. AAPL hasn’t closed at a record high since late December, while the S&P 500 is on pace today for its 20th record close of the year. Also, back in February, when the S&P 500 was making new highs, AAPL topped out with a lower high. In the rally off the April lows, as well, the S&P 500 surged, but from mid-May through early August, AAPL moved sideways. As a result of their divergent paths, the correlation between the closing prices of AAPL and the S&P 500 over the last year has been just +0.27.
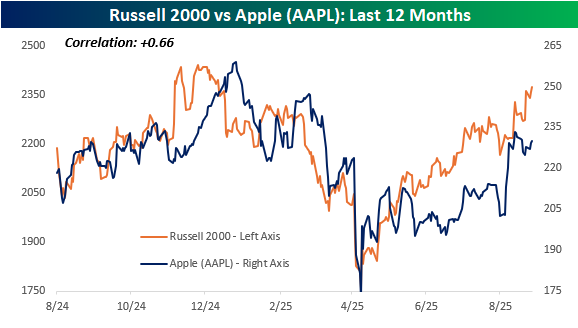
Where things really get interesting is when you compare the performance of AAPL versus the Russell 2000 over the last year. AAPL may be the third-largest stock in the world, but it has tracked the performance of the Russell 2000 much more closely than the S&P 500. Don’t take our word for it, just look at the chart. While the correlation between AAPL and the S&P 500 over the last year has been just 0.27, with the Russell 2000, it has been +0.66!
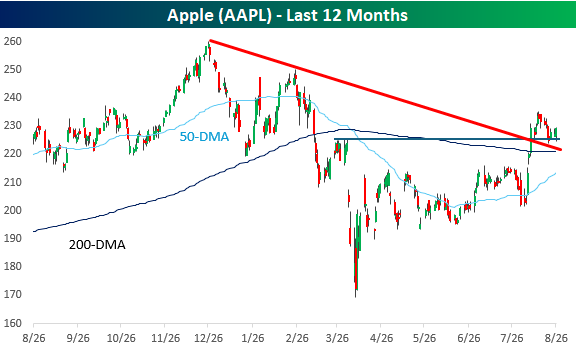
Whether AAPL trades more like a small cap than a large cap can be debated, but what about AAPL itself? After trading in a sideways range from late March through early August, AAPL finally broke out of that range just over two weeks ago and broke its downtrend from last December’s high in the process. Immediately after that breakout, the stock tested those breakout points, and provided those levels hold in the days ahead, you probably won’t be hearing that the market can’t rally without AAPL much in the weeks ahead.
More By This Author:
Supply, Not Sun, Powers Housing GainsExploring Trends Across Asset Classes, Mega-Caps, And Banks
If Alphabet "Missed The AI Boat", What Does That Mean For Microsoft?


Comments
Log in or sign up to join the conversation.