
A Lesson For Us All
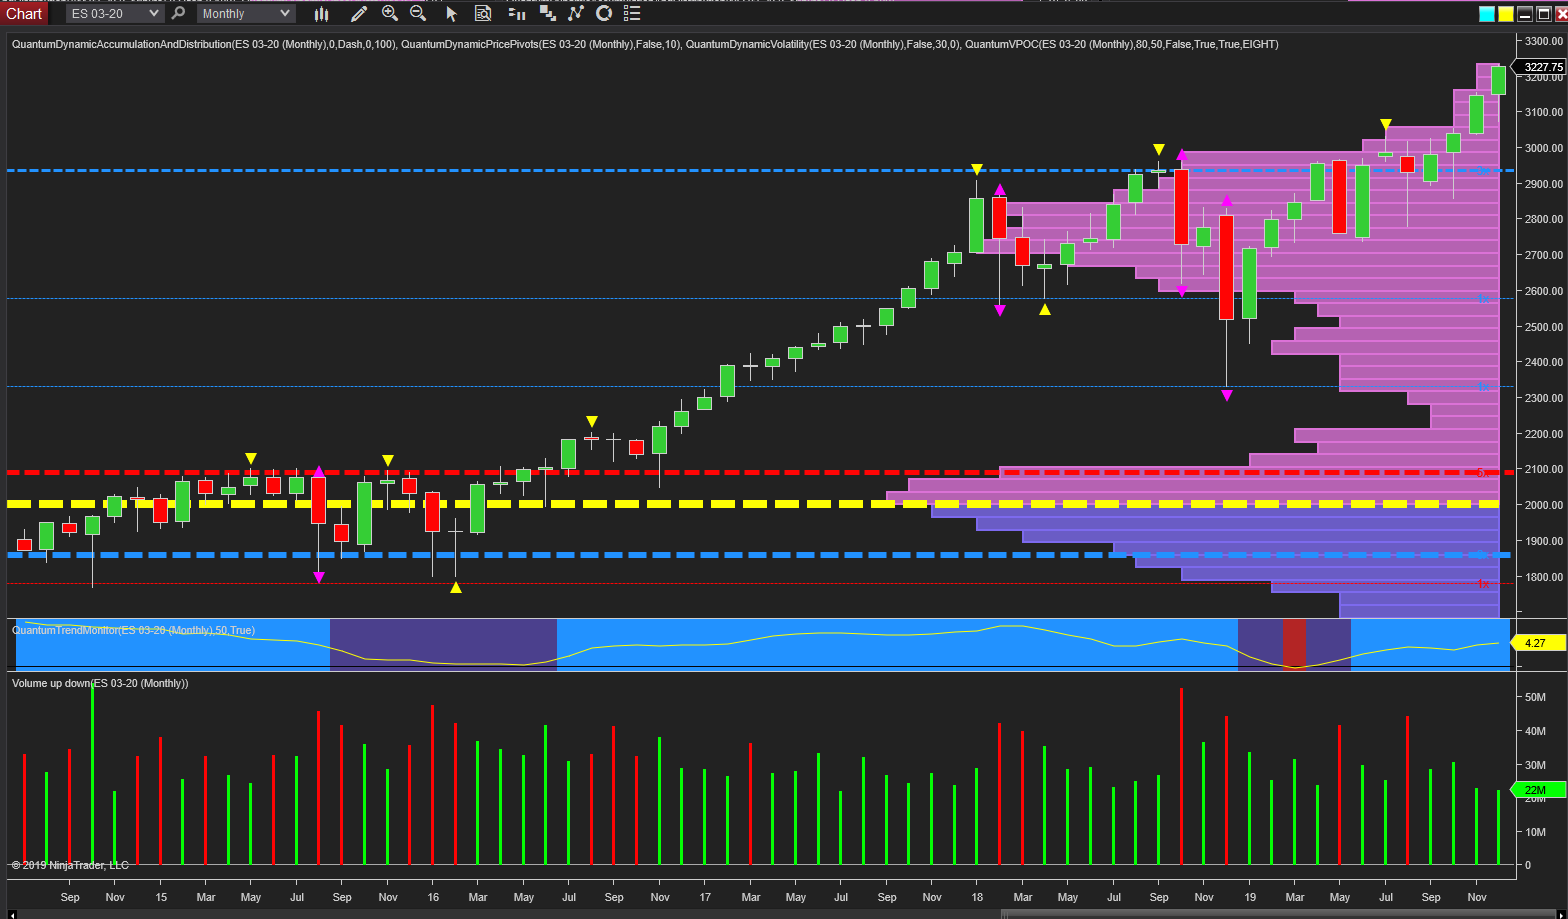
As we come to the end of another trading year, it’s always interesting to look back and consider the charts on a slower timeframe, and in this case, it’s the ES Emini on a monthly timeframe, and from it one particular lesson which we all need to remember.
And starting with the trading lesson, it is simply this – never trade with an opinion. Trade what you see on the chart. Over the last twelve months, this has been one truism which many have found hard to follow, as analysts and experts alike have been calling the top saying it cannot go any higher with a major correction imminent. I hasten to add, I have not been one of them, a fact you can check on my site! The problem for us as traders, it is easy to be swayed into such a mindset, and see every correction as the start of a bear market. In other words, the big short. A fellow trader fell into this trap repeatedly in October, and as each day arrived, he was convinced it was time to short the market which would not, and could not, go any higher. Each of these ‘reversals’ duly became short term corrections with the market continuing on higher in each case.
So what’s the answer. First, tune out the commentariat and trade what you see on the chart. Second, apply volume price analysis which reveals the truth behind the price action. Third, remember Wyckoff’s second law of cause and effect. If we are to witness a major correction in 2020, then two things must occur. The first price action must reflect a distribution top with a predominance of wicks to the upper body of the various candles. Second, we should see volatility associated with the candles, and third and last, this must extend over a period of time. In other words, if Wyckoff’s second law is to be upheld, then a major correction requires a major top which will only develop as a result of time. Then and only then will the big short develop.
The view that 2019 would herald the big short began at the end of 2018 when the US was characterized with two sharp falls, which raised the clarion call of a bear market in some quarters, but when you consider the buying volume associated with each correction, and the appearance of the volatility indicator signaling congestion or a reversal, progress in 2020 has been much as expected. Yes, we had the move lower in May but this was followed by the recovery in June that duly created a two-bar reversal. In other words, buying. The same was true in August, but in this case, a single candle with heavy buying denoted with the high volume. And finally in October with the minor correction creating the lower wick to the body of the candle and into the hurrah of the current Santa rally on steady volume.
So where next in 2020? From a technical perspective, we have a low volume area head on the volume point of control histogram moving to 3300 and beyond as the index continues to break out into new high ground. No doubt there will be injections of volatility courtesy of the US President for which we are truly grateful as intraday traders. But for those trading with an opinion, please set this aside as it can seriously damage your wealth.
(Click on image to enlarge)
Disclaimer: Futures, stocks, and spot currency trading have large potential rewards, but also large potential risk. You must be aware of the risks and be willing to accept them in order to invest in ...
more

