
A History Of Wealth Creation In The U.S. Equity Markets
Hendrik Bessembinder contributes to the literature on the returns to public equity investment diversification benefits with his study “Wealth Creation in the US Public Stock Markets 1926-2019,” published in the April 2021 issue of The Journal of Investing. The study updated his 2018 paper, “Do Stocks Outperform Treasury Bills?,” (Summary and More) adding three more years of data. He analyzed the long-run stock market outcomes in terms of the increases or decreases (relative to a T-bills benchmark) in shareholder wealth creation (SWC), considering the full history of both net cash distributions and capital appreciation. His data sampled included all the 26,168 firms with publicly traded U.S. common stock since 1926. In calculating the change in net worth, he explicitly accounted for new share issuances, share repurchases, and the fact that dividends are not (in aggregate) reinvested in the stock market—share repurchases and dividends reduce market capitalization but do not similarly decrease calculated shareholder wealth creation. Following is a summary of his key findings:
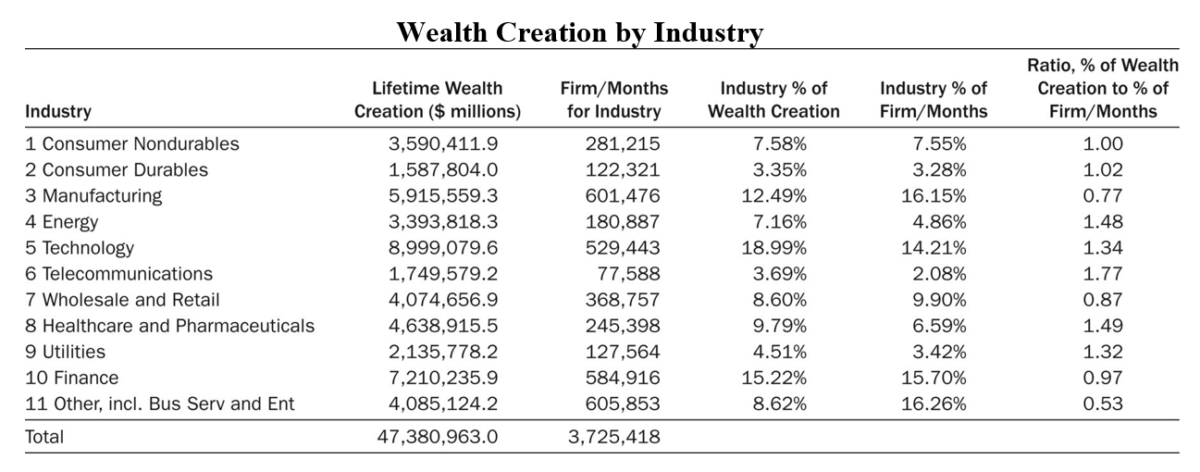
- U.S. stock market investments increased shareholder wealth on net by $47.4 trillion between 1926 and 2019.
- Technology firms accounted for the largest share—$9.0 trillion—of the total, but telecommunications, energy and healthcare/pharmaceutical stocks created wealth disproportionate to the numbers of firms in the industries—although high-performing tech stocks such as Apple, Microsoft and Alphabet rightly receive a great deal of attention, tech stocks as a group have not been the most reliable performers in the long run.
- Tech stocks performed more modestly during other periods. For example, they contributed negatively during downturn periods such as 1969-71 (20.0 percent of the market’s negative net wealth creation), 1972-74 (10.9 percent of the market’s negative net wealth creation) and particularly 1999-2001 (46.2 percent of the market’s negative net wealth creation).
The results are hypothetical results and are NOT an indicator of future results and do NOT represent returns that any investor actually attained. Indexes are unmanaged, do not reflect management or trading fees, and one cannot invest directly in an index.
- The majority (57.8 percent) of stocks led to reduced rather than increased shareholder wealth.
- Aggregate shareholder wealth creation is concentrated in a relatively few high-performing stocks.
- The degree to which stock market wealth creation is concentrated in a few top-performing firms has increased over time and was particularly strong during the most recent three years of the study, when five firms accounted for 22 percent of net wealth creation.
- During that most recent three-year period, 0.04 percent of firms (two of the 4,896 firms with stocks listed) accounted for 10 percent of the $12.8 trillion in gross wealth creation, 0.16 percent of firms (eight of the 4,896) accounted for 25 percent of the gross wealth creation, and 0.98 percent of firms (48 of the 4,896) accounted for half the gross wealth creation.
- The concentration of SWC is attributable to positive skewness in the distribution of long-run stock market outcomes. Since most individual outcomes in a positively skewed distribution are less than the average outcome, this implies that undiversified portfolios selected at random will underperform the overall market more often than not, reinforcing the prudence and desirability of low-cost, broadly diversified strategies.
Following are important findings from his earlier paper in which he ran simulations:
- A single-stock strategy underperformed the value-weighted market in 96 percent of bootstrap simulations (a test that relies on random sampling with replacement) and underperformed the equal-weighed market in 99 percent of the simulations.
- The single-stock strategy outperformed the one-month Treasury bill in only 28 percent of the simulations.
- Only 3.8 percent of single-stock strategies produced a holding period return greater than the value-weighted market, and only 1.2 percent beat the equal-weighted market over the full 90-year horizon.
Bessembinder also found that the 86 top-performing stocks, less than one-third of 1 percent of the total, collectively accounted for more than half the wealth creation. And the 1,000 top-performing stocks, less than 4 percent of the total, accounted for all the wealth creation. The other 96 percent of stocks just matched the return of riskless one-month Treasury bills! The implication is striking: While a large equity risk premium has been available to investors, a large majority of stocks have negative risk premiums. This finding demonstrates just how great the uncompensated risk is that investors who buy individual stocks (or a small number of them) accept—risks that may be diversified away without reducing expected returns. Bessembinder concluded that his results help explain why active strategies, which tend to be poorly diversified, most often lead to underperformance.
His findings led Bessembinder to conclude that while the results highlight the potential benefits of successful active investing, “these results should be of interest to any long-term investor assessing the relative merits of broad diversification versus narrow portfolio selection.” While acknowledging the benefits of broad, low-cost diversification (diversification reduces skewness) he noted: “Some investors may rationally prefer positive skewness in the distribution of outcomes.” He added: “The outcomes here can justify the selection of concentrated portfolios for those investors who strongly prefer the possibility (even if slight) of a vast wealth increase.” He highlighted this in his earlier paper, noting that investors who particularly value the possibility of “lottery-like” outcomes should acknowledge that the poorly diversified portfolio will most likely underperform. Bessembinder showed the impact of the preference for “lottery tickets” with this finding: Only 31.5 percent of monthly returns to stocks in the lowest share price decile exceeded one-month Treasury bill rates compared to 59.1 percent of monthly returns to stocks in the highest share price decile.
Bessembinder ended his new paper with the following caution:
“The results here, based on a long historical record, indicate that it should be anticipated that the net wealth creation or destruction attributable to the overall stock market in future years will be concentrated in relatively few firms. Although the implications of these insights for optimal portfolio decisions depend both on investors’ taste for skewness and their perceived level of investing skill, all investors should be aware that long-term stock market wealth creation has historically been concentrated in a few firms and that the degree of concentration has increased in recent years. There is no reason to think that wealth creation outcomes will not also be highly concentrated in the future.”
Bessembinder’s findings are consistent with those of the authors of a study by Longboard Asset Management, “The Capitalism Distribution,” covering the period 1983 through 2006 utilizing the top 3,000 stocks. The authors found that while the Russell 3000 Index provided an annualized return of 12.8 percent and a cumulative return of 1,694 percent:
- The median annualized return was just 5.1 percent, 7.7 percent below the return of the market.
- The average (mean) annualized return was -1.1 percent.
- 39 percent of stocks lost money (even before inflation) during the period.
- 19 percent of stocks lost at least 75 percent of their value (again, before considering inflation).
- 64 percent of stocks underperformed the Russell 3000 Index.
- Just 25 percent of stocks were responsible for all the market’s gains.
Investors picking stocks had almost a two-in-five chance of losing money (meaning they underperformed by at least 1,694 percent) even before considering inflation (which was a cumulative 107 percent) and almost a one-in-five chance of losing at least 75 percent of their investment, again even before considering inflation. And there was just greater than a one-in-three chance of picking a stock that outperformed the index.
Bessembinder added this observation in his 2018 paper:
“The results here focus attention on the fact that poorly diversified portfolios may underperform because they omit the relatively few stocks that generate large positive returns. The results also help to explain why active portfolio strategies, which tend to be poorly diversified, most often underperform their benchmarks. Underperformance is typically attributed to transaction costs, fees, and/or behavioral biases that amount to a sort of negative skill. The results here show that underperformance can be anticipated more often than not for active managers with poorly diversified portfolios, even in the absence of costs, fees, or perverse skill.”
Behavioral Errors Compound the Problem
Compounding the problem of poorly diversified portfolios is that we know from a series of studies by Brad Barber and Terrance Odean, such as “The Behavior of Individual Investors,” that individual investors are poor stock pickers. For example, they found that the stocks both men and women buy trail the market after they buy them, and the stocks they sell outperform after they are sold. Yet they persist in the effort. Why? Following is a brief list of some of the reasons:
- The majority of investors have not studied financial economics, read financial economic journals, or read books on modern portfolio theory. Thus, they don’t have an understanding of how many stocks are required to build a truly diversified portfolio. Similarly, they don’t understand the difference between compensated and uncompensated risk. The result is that most investors hold portfolios with assets concentrated in relatively few holdings.
- Richard Thaler of the University of Chicago and Robert Shiller, a Nobel Prize-winning economics professor at Yale, noted that “individual investors and money managers persist in their belief that they are endowed with more and better information than others, and that they can profit by picking stocks.” This insight helps explain why individual investors don’t diversify: They believe they can pick stocks that will outperform the market. Overconfidence is an all-too-human trait.
- People make investment decisions based on what they believe is important, or what economists call “value relevant” information. They virtually never consider that others, with far more resources than they have, almost certainly have the same information. Thus, that information must already be “baked into” prices. Mark Rubenstein, a professor at the University of California, Berkeley, put it this way: “One of the lessons of modern financial economics is that an investor must take care to consider the vast amount of information already impounded in a price before making a bet based on information.” Legendary investor Bernard Baruch put it more succinctly, stating: “Something that everyone knows isn’t worth knowing.” The failure to understand this leads to a false sense of confidence, which in turn leads to a lack of diversification.
- Investors have the false perception that by limiting the number of stocks they hold, they can better manage their risks.
- Investors gain a false sense of control over the outcomes by being involved in the process. They fail to understand it is the portfolio’s asset allocation that determines risk, not who is controlling the switch.
- Investors confuse the familiar with the safe. They believe that because they are familiar with a company, it must be a safer investment than one with which they are unfamiliar. This leads them to concentrate their holdings in a few companies with which they are familiar, essentially Peter Lynch’s advice to “buy what you know.” Unfortunately, a study found that the returns of local stocks investors purchased badly lagged the returns of local stocks sold.
Individual Stocks Are Risky
Individual stocks are much riskier than most investors believe. The reason is that stock returns are not normally distributed—the dispersion of individual stock returns does not resemble a bell curve, where the median return is the same as the mean return. If the dispersion of individual stock returns resembled the bell curve, the returns of half the stocks would be above the mean, and half would fall below the mean. As you have seen, this isn’t the case. The reason is that while your profits are unlimited, you can only lose 100 percent of your investment. For example, the authors of the aforementioned study “The Capitalism Distribution” found that 6.1 percent of the stocks outperformed the market by more than 500 percent. As a result, there were more stocks that had below “average” returns than there were stocks with above “average” returns. The left tail of the distribution was similarly skewed, with 3.9 percent of the stocks underperforming the market by more than 500 percent. Both tails provide investors with the hope that they can outperform by owning the big winners and avoiding the big losers.
Summary
Investors make mistakes when they take idiosyncratic, diversifiable, uncompensated risks. They do so because they are overconfident of their skills; they overestimate the worth of their information; they confuse the familiar with the safe; they have the illusion of being in control; they don’t understand how many individual stocks are needed to effectively reduce diversifiable risks, and they don’t understand the difference between compensated and uncompensated risks (some risks are uncompensated because they are diversifiable).
Another likely explanation from the field of behavioral finance is the aforementioned preference by many investors for positive skewness. They are willing to accept the high likelihood of underperformance in return for the small likelihood of owning the next Google. In other words, they like to buy lottery tickets.
If you have made any of these mistakes, you should do what all smart people do: Once they have learned that a behavior is a mistake, they correct their behavior.
Disclaimer: Performance figures contained herein are hypothetical, unaudited and prepared by Alpha Architect, LLC; hypothetical results are intended for illustrative purposes only. Past ...
more

