70/20/10 Rule Redux
Image Source: Pixabay
A friend of our stock-picking discipline reminded us of a very important force in the stock market. It was called the 70/20/10 rule, and it was promoted by Roger Edelman, Richard Evans, and Gregory Kadlec in an early 2013 Financial Analysts Journal article. We had written about this in 2016, but today’s circumstances beg for a reminder.
Part one of the rule said that in the next 12 months, the return you got on a stock was 70% determined by what the U.S. stock market did, 20% was determined by how the industry group did, and 10% was based on how undervalued and successful the individual company was. Part two of the rule said that over ten years, 70% of how you did would be determined by the valuation and success of your company, 20% by how the industry did and 10% would be determined by how the stock market did.
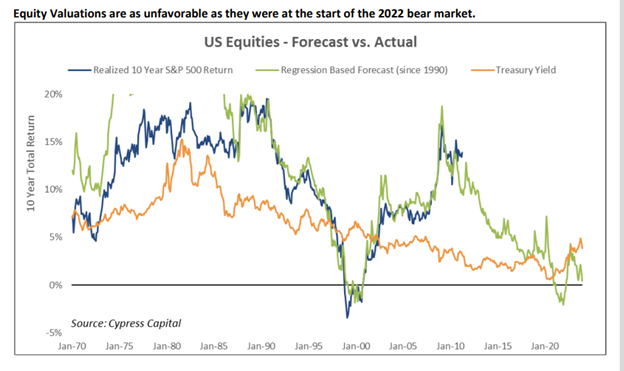
This is especially important in an overall expensive U.S. stock market as we start the year 2024. Here is one chart that would argue that your hope for successful stock market participation won’t come from passive S&P 500 Index investing:

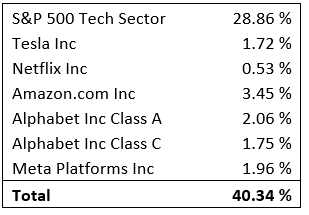
Second, we are coming off of a massive financial euphoria event Charlie Munger called the biggest of his career because of the “totality of it!” And we have moved into the last phase of it by concentrating most of the index and active manager portfolios in the largest and most popular glam tech stocks. The hype on AI has all the markings of a culmination of four years of euphoria.

Third, psychological reversals usually take one to three years, but this FANG/Magnificent 7 episode has gone much longer than some previous episodes. It looks like those who are buying the passive S&P 500 Index as a diversified portfolio of stocks are getting a glam growth fund with some diversification. The chart below shows who was popular at the end of each decade and how it seems to change massively every ten years:

This should concern index investors because those 40 years saw declining interest rates and an overall very favorable stock market. Just look at how bad the index did as it came off the Dotcom bubble in early 2000. The S&P 500 lost 1% per year from the end of 2000 to the end of 2010. These miserable results included two bear market declines exceeding 40% in the index.
Another important aspect of working in ten-year time frames is it keeps portfolio turnover low. A Merrill Lynch advisor told us in 2012 that “your portfolio is like a bar of soap; the more you rub it, the smaller it gets.” Low turnover also keeps the IRS out of your life as you ride winners to a fault.
Low turnover must be attached to companies that generate high free cash flow because you can sit through the inevitable bear markets and/or spring back to life faster when the bear market ends. Never forget to think of our companies the way you would view them if their shares didn’t trade for five years.
More By This Author:
Long-Term Puzzle Pieces
Stepping On A Rake
Stock Market Psychology
Disclosure: The information contained in this missive represents Smead Capital Management’s opinions, and should not be construed as personalized or individualized investment advice and ...
more


