
Stagflation is a term that is invoked in a CNN article today. I think of stagflation as weak growth combined with high inflation. A little context:
As noted here, advance estimate for q/q GDP growth is 1.6%, below 3.4 consensus. But as discussed here, GDP+ is at 2.6%, and final sales to private domestic purchasers is running 3.0%. In addition we have the following key monthly indicators followed by the NBER’s Business Cycle Dating Committee.
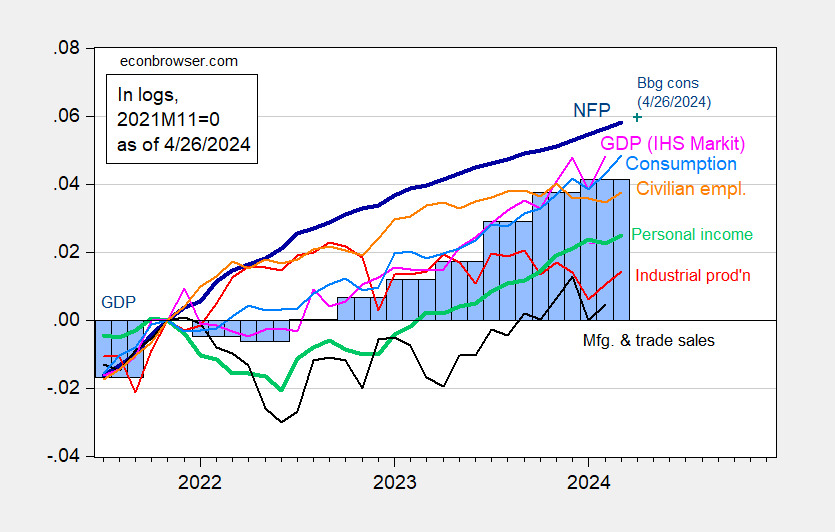
Figure 1: Nonfarm Payroll (NFP) employment from CES (bold blue), civilian employment (orange), industrial production (red), personal income excluding current transfers in Ch.2017$ (bold green), manufacturing and trade sales in Ch.2017$ (black), consumption in Ch.2017$ (light blue), and monthly GDP in Ch.2017$ (pink), GDP, 3rd release (blue bars), all log normalized to 2021M11=0. Source: BLS via FRED, Federal Reserve, BEA 2024Q1 advance release, S&P Global Market Insights (nee Macroeconomic Advisers, IHS Markit) (4/1/2024 release), and author’s calculations.
Note that NFP, civilian employment, personal income, consumption, and industrial production all rose in March. One could use alternative proxies for GDP, monthly GDP, and NFP. I use respectively GDP+, Philadelphia Fed coincident index, and Philadelphia Fed early benchmark NFP.
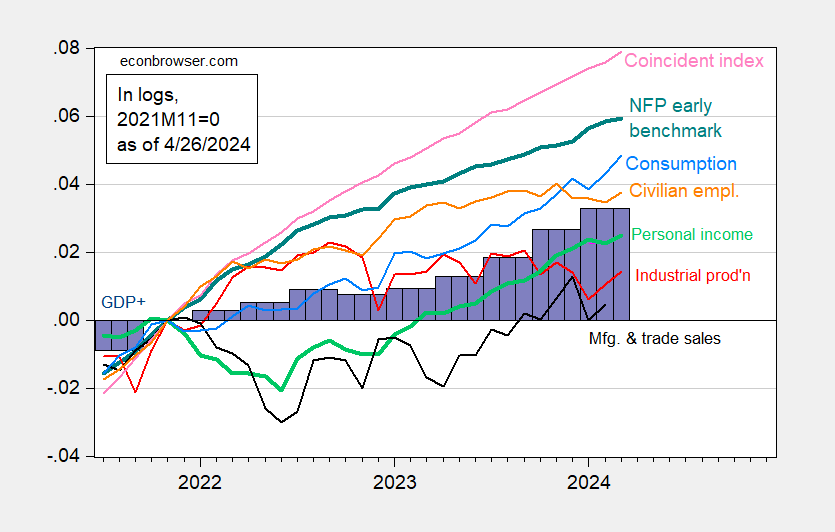
Figure 1: Nonfarm Payroll (NFP) employment adjusted by ratio of early benchmark sum-of-states to post-benchmark sum-of-states (bold teal), civilian employment (orange), industrial production (red), personal income excluding current transfers in Ch.2017$ (bold green), manufacturing and trade sales in Ch.2017$ (black), consumption in Ch.2017$ (light blue), and coincident index (light pink), GDP+ release (violet bars), all log normalized to 2021M11=0. Source: BLS via FRED, Federal Reserve, BEA 2024Q1 advance release, Philadelphia Fed [1], [2], [3]. and author’s calculations.
For thinking about inflation trends, I show below instantaneous inflation (Eeckhout, 2023) for headline and for core PCE and CPI:
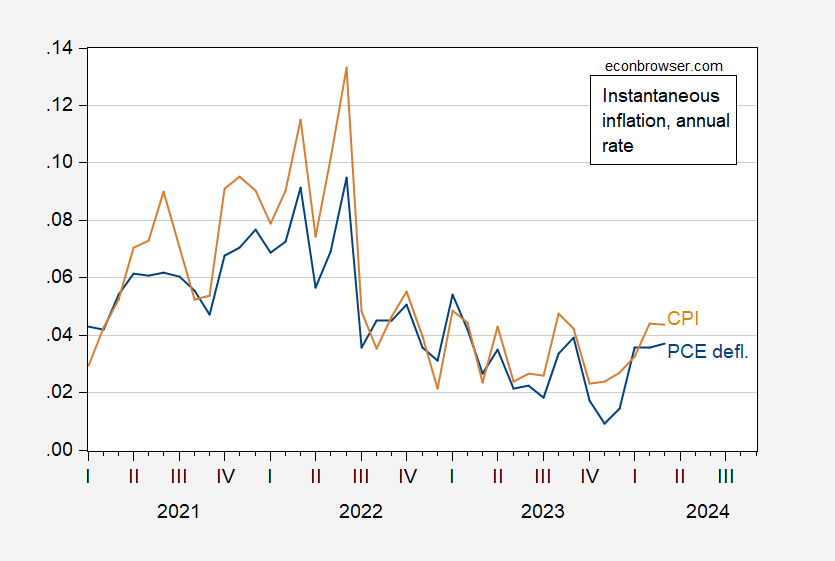
Figure 3: Instantaneous inflation for PCE deflator (blue), and CPI (tan), per Eeckhout (2023). Source: BEA, BLS, via FRED and author’s calculations.
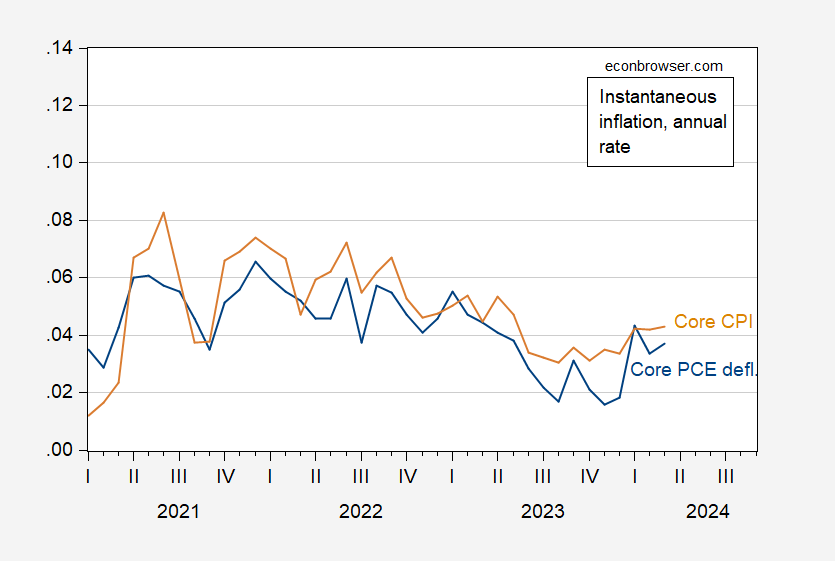
Figure 4: Instantaneous inflation for core PCE deflator (blue), and core CPI (tan), per Eeckhout (2023). Source: BEA, BLS, via FRED and author’s calculations.
With economic activity y/y growth ranging from about 2.2-2.9 ppts when trend is around 2 ppts, and trend inflation around 4 ppts, I’m not sure “stagflation” is the right term.
More By This Author:
GDP, Nowcasts, And Est’d GDO, GDP+, And Final Sales
Almost Landed
The Value Of The Chinese Yuan: Down 15% Since 2022M03


Comments
Log in or sign up to join the conversation.