
Spot The Incipient Recession
Most accounts these days suggest the risk of recession has abated, given the strength of various indicators, and the un-inversion of the yield curve. This made me wonder what two key indicators look like in real time on the eve of a recession. Take a look at these two graphs, to see which one denotes data just before a recession.
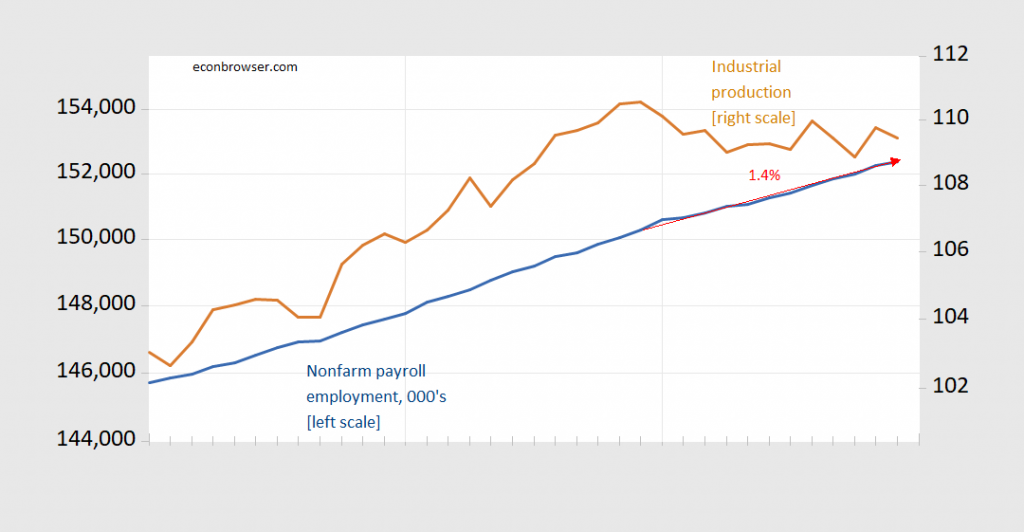
Figure 1: Nonfarm payroll employment, 000’s (blue, left log scale), industrial production (tan, right log scale). Each tick denotes a month. Red arrow and associated number denotes y/y growth rate, in log terms. Source: BLS, Federal Reserve via ALFRED.
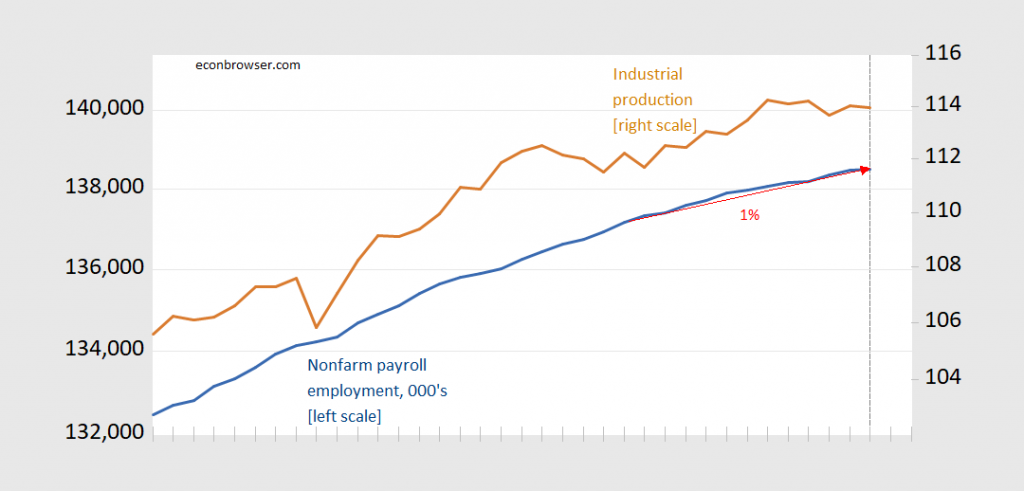
Figure 2: Nonfarm payroll employment, 000’s (blue, left log scale), industrial production (tan, right log scale). Each tick denotes a month. Red arrow and associated number denotes y/y growth rate, in log terms. Source: BLS, Federal Reserve via ALFRED.
It turns out Figure 2 denotes the data before the 2007-09 recession (the sample is 2005M01-2008M01). Figure 1 shows data available as of mid-January 2020, for the 2017M01-2019M01 period. The dashed line in Figure 2 denotes the NBER-identified peak month…
Disclosure: None.


