
Some Observations On The Q1 GDP Release
Following up on Jim’s post, here's some additional comments on the Q1 GDP growth surprise of -1.4% SAAR; GDPNow was 0.4%, while IHS-Markit was -0.6% (and was way below Bloomberg consensus of 1.1%). What to take from this?
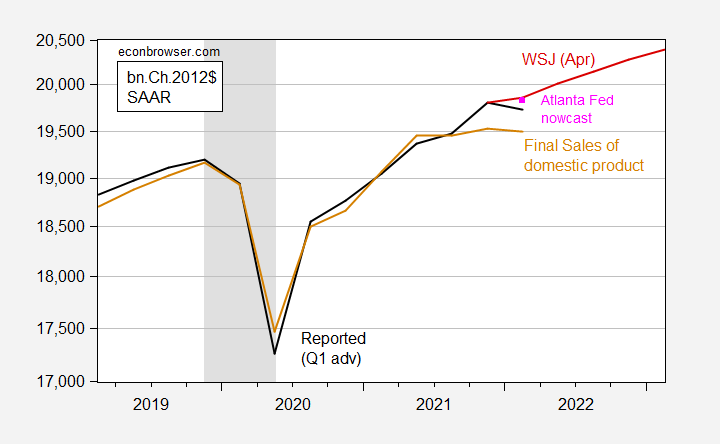
Figure 1: GDP (black), Atlanta Fed nowcast as of 4/27 (pink square), WSJ April survey mean forecast (red line), and final sales of domestic product (brown), all in billions of Ch.2012$, SAAR. NBER defined recession dates peak-to-trough shaded gray. Source: BEA 2022Q1 advance release, Atlanta Fed, WSJ April survey, and author’s calculations.
Jim’s post on the GDP release noted that imports were a big mover, and that there was some question regarding oil exports. It’s important to recall that there are a lot of estimated components in the advance GDP figure; for instance, March trade figures are finalized after the advance GDP release. Hence, the release taking place at the end of May will show revisions for GDP and components.
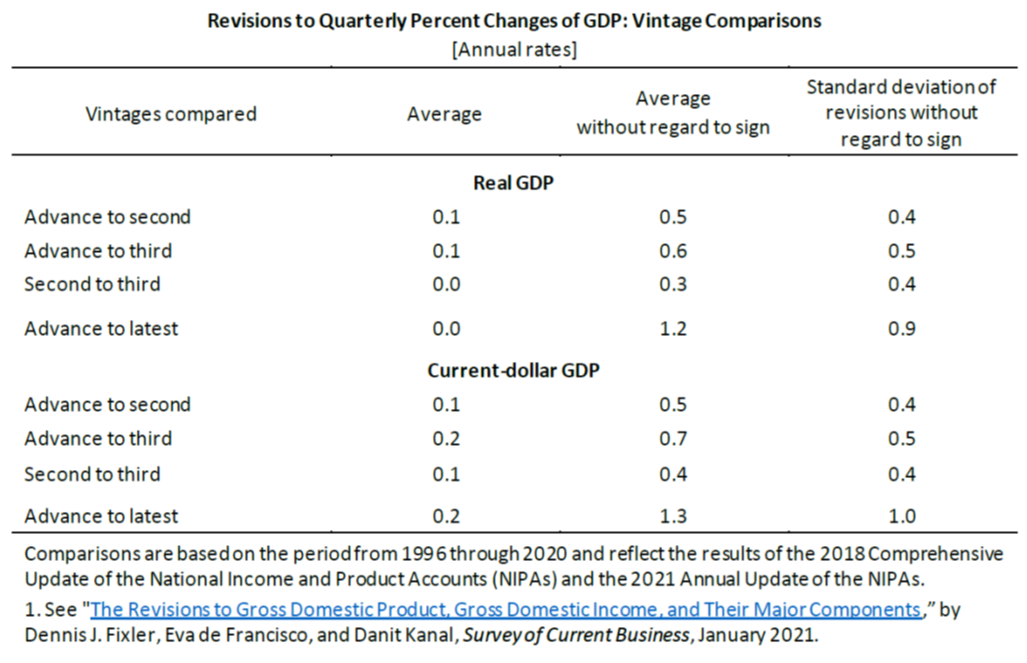
Source: BEA (2021).
The mean absolute revision (MAR) going from advance to second release is 0.5 ppts, and from advance to third (in this case coming out in June) is 0.6 ppts. When the dust finally settles years from the advance release, the MAR is 1.2 ppts. For now, however, we can be reasonably sure that GDP growth was negative in Q1.
While we care about total production (which is GDP), we are perhaps even more interested in aggregate demand (expenditures taking out inventory). On the other hand, as shown in Figure 1, final sales of domestic product (that GDP is taking out inventory changes) was down only 0.6 ppts (SAAR).
CEA stresses final sales to domestic purchasers (C+I+G-inventory change) as a measure of domestic momentum; that grew 3.7% SAAR. This is what some observers are taking comfort from (including consumption growth, which continued into March):

Figure 2: Nonfarm payroll employment (dark blue), Bloomberg consensus for April NFP (blue +), industrial production (red), personal income excluding transfers in Ch.2012$ (green), manufacturing and trade sales in Ch.2012$ (black), consumption in Ch.2012$ (light blue), and monthly GDP in Ch.2012$ (pink), all log normalized to 2020M02=0. NBER defined recession dates, peak-to-trough, shaded gray. Source: BLS, Federal Reserve, BEA, via FRED, IHS Markit (nee Macroeconomic Advisers) (4/1/2022 release), NBER, and author’s calculations.
Most tracking estimates for Q2 are around 2% (IHS-Markit, GDPNow), based on data available now.
Disclosure: None.


