
Record Low Mortgage Rates; Highest Purchases Since 2009
Over the course of the past couple of years, the national average for a 30 year fixed rate mortgage has been on the decline with the only significant spike higher being a temporary one in March of this year. By April, the national average had fallen back to levels prior to the spike, and beginning in June mortgage rates began accelerating to the downside. Just yesterday, the national average was 3.21% which is the lowest level since at least 1998.

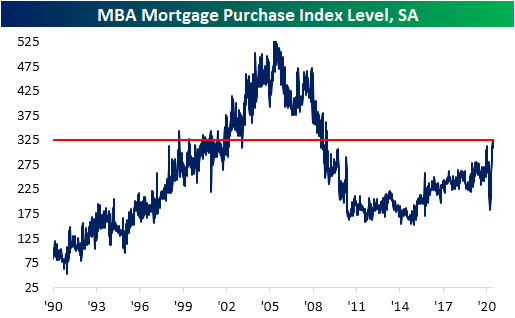
As a result of those affordable rates, purchases have continued to surge. Despite the back to back weekly declines over the past two weeks—snapping a record streak of increases in purchase applications at nine consecutive weeks long and the first back to back declines since April—MBA’s purchase index came roaring back this week rising 5.34% WoW. That brings the index to its highest level since the first week of January 2009. This week’s increase was also the largest WoW gain since the week of May 22nd.
On a non-seasonally adjusted basis, purchase applications were actually lower on the week, but that does not mean that they were not strong. As shown in the chart below, on a non-seasonally adjusted basis, as could be expected due to seasonal trends, purchases remain below their peak from the second week of June of this year but are also still well above any readings for the current week of the year over the past decade.
Taking the Fourth of July holiday into account, this week’s reading was perhaps even more impressive. Purchases typically experience a sharp drop during the week of July 4th. In the past decade, the index has declined an average of 37 points during the Fourth of July holiday week, but this year, the decline was just half of that with the NSA index only falling 18 points. In other words, seasonal trends around the holiday appeared to have been softer than normal this year.

With this week’s strength, there is another positive that comes from this yesterday's morning release. Over the past several weeks’ we have noted that despite strength in purchases later than seasonally normal, damage from earlier in the year had left purchases down on a year to date basis versus last year. That changed this week. With a stronger than normal July 4th week, average purchase apps YTD through the first 27 weeks of the year are now actually the highest of the past decade.

Disclaimer: To begin receiving both our technical and fundamental analysis of the natural gas market on a daily basis, and view our various models breaking down weather by natural gas demand ...
more

