

Image source: Pixabay
Since most of my lecture notes have migrated behind a gate (software called Canvas, used on many campuses), I thought I would share some teaching material that some Econbrowser readers might find of interest.
First, recession vs. output gap (Econ 442 Lecture 9):
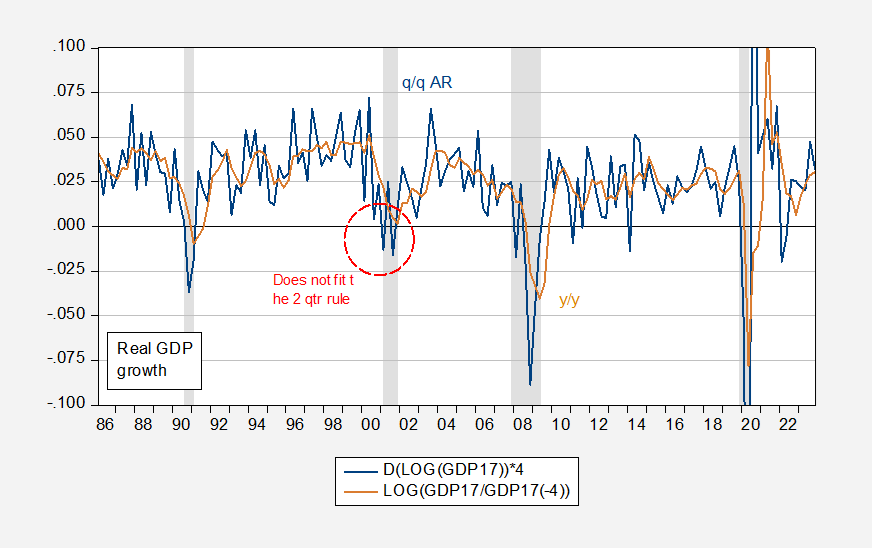
Figure 1: Quarter on Quarter growth rate of real GDP (blue), Year on Year (tan), both calculated as log differences. NBER defined peak-to-trough recession dates shaded gray. Source: BEA, NBER, and author’s calculations.
Note there is no NBER-defined recession in 2022H1, despite two consecutive quarters of negative GDP growth. In contrast, there was a NBER-defined recession in 2001, despite the absence of two consecutive quarters of negative growth in the latest vintage of GDP (when was it that there were? See here.). Hamilton’s Markov Switching model of recessions did not indicate a recession then, nor did the real-time Sahm rule.
I distinguish between an output gap and recession by referring to this graph:
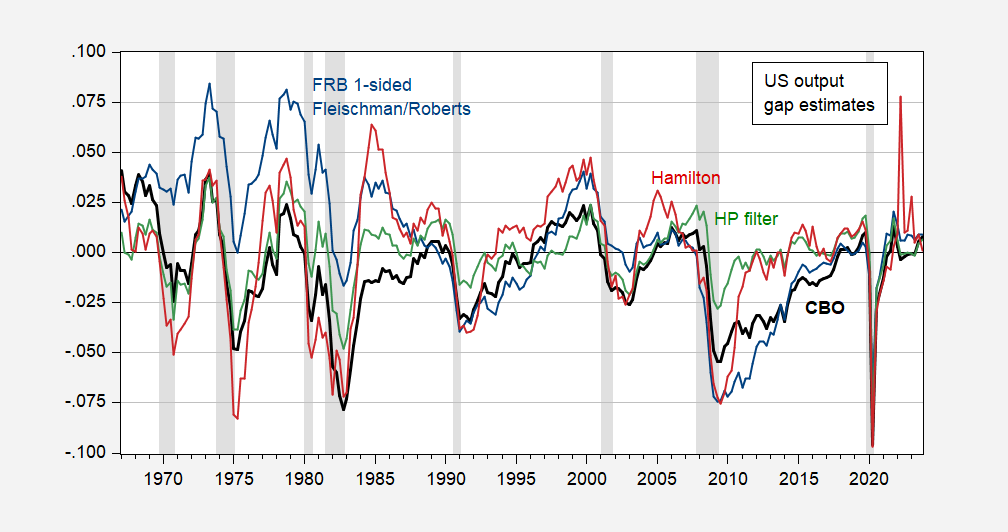
Figure 2: Output gap, from CBO (bold black), from Fleischman/Roberts-FRB (blue), from HP filter estimated over 1947-2023 (green), and from Hamilton filter estimated over 1967-2023 (red). NBER defined peak-to-trough recession dates shaded gray. Source: BEA, CBO February 2024, Atlanta Fed Taylor rule utility February 2024, NBER, and author’s calculations.
Note that for the Euro area, CEPR’s BCDC noted two consecutive quarters of negative growth in 2023 GDP, but has also not declared a recession, given increases in employment and hours worked.
What about recession prediction? That’s discussed in this handout (Recession Early Warning Systems). Given the continued yield curve inversions, it’s not surprising that estimated recession probabilities are high. On the other hand, my research with Ferrara, Ahmed, Kucko and Chatelais and Stalla-Bourdillon suggests other predictors. Those provide alternative estimates of recession probabilities. Below I examine the impact of the foreign term spread as well as the debt service ratio.
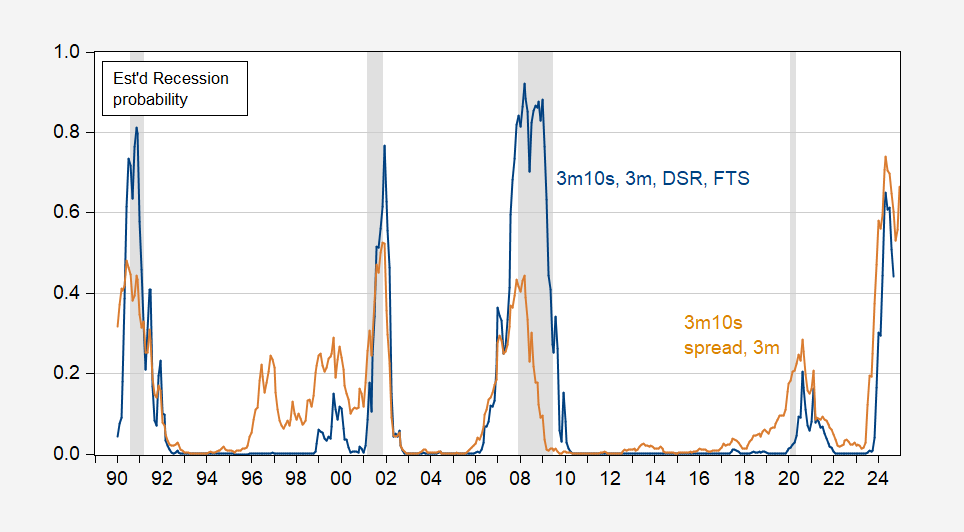
Figure 3: Probability of recession from term spread and short rate (tan), and term spread and short rate, debt-service ratio, foreign term spread (blue). NBER defined peak-to-trough recession dates shaded gray. Source: NBER, and author’s calculations.
As I note in the handout:
…the estimated recession probabilities for February 2024 are 56% for the spread plus short rate, and 29.5% for the full specification. This means just because there are no obvious indications of the recession’s onset as of January doesn’t mean that we have necessarily dodged a recession. May 2024 are maximal probabilities.
So, stay on guard for evidence of a downturn.
As an aside, this is an example of how research informs teaching.
More By This Author:
Exchange Rate Pass Through Into Import Prices, CPIBusiness Cycle Indicators, Mid-February 2024
Output Gap Measures


Comments
Log in or sign up to join the conversation.