
Bulls Make A Break For It
Let’s pick up with where we left off last week:
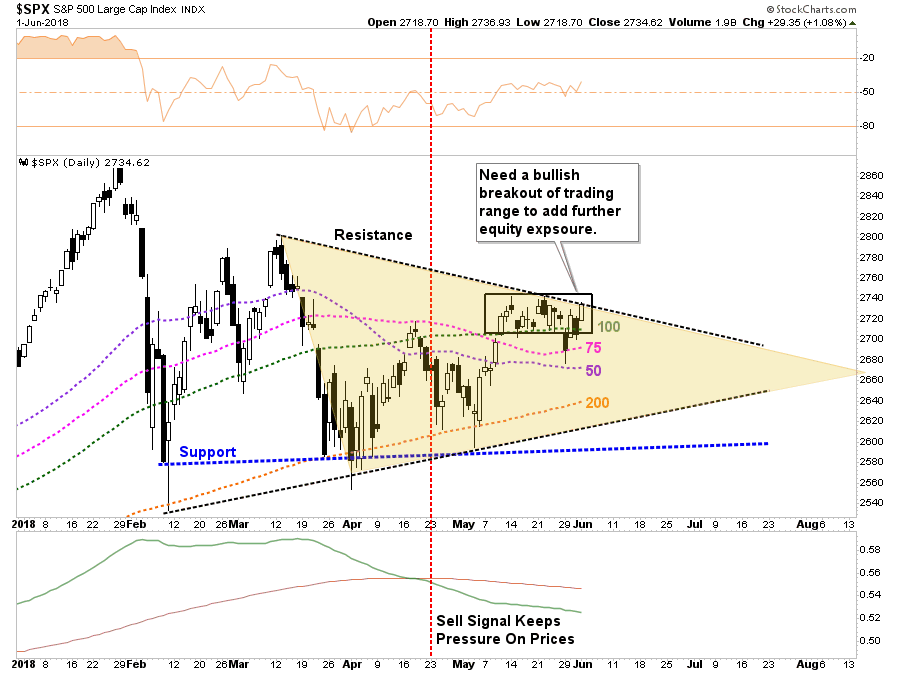
“There wasn’t any “bad news,” so to speak, so the “mediocre” news is that despite the solid rise in the markets from Tuesday’s low, we remain very range bound between the 100-dma and the closing highs over the last couple of weeks as shown below. The tan shaded area is the current consolidation process from the March highs.”
This past week, that breakout did occur and pushed prices, as expected, to the first level of resistance which resides at the late February highs.

As shown, there is a significant amount of overhead resistance between 2780 and 2800 which may present a challenge in the short-term to a further advance. However, I suspect any weakness next week will likely provide a decent opportunity to increase equity exposure modestly.
This idea aligns with the updated the “pathway analysis” from last week.
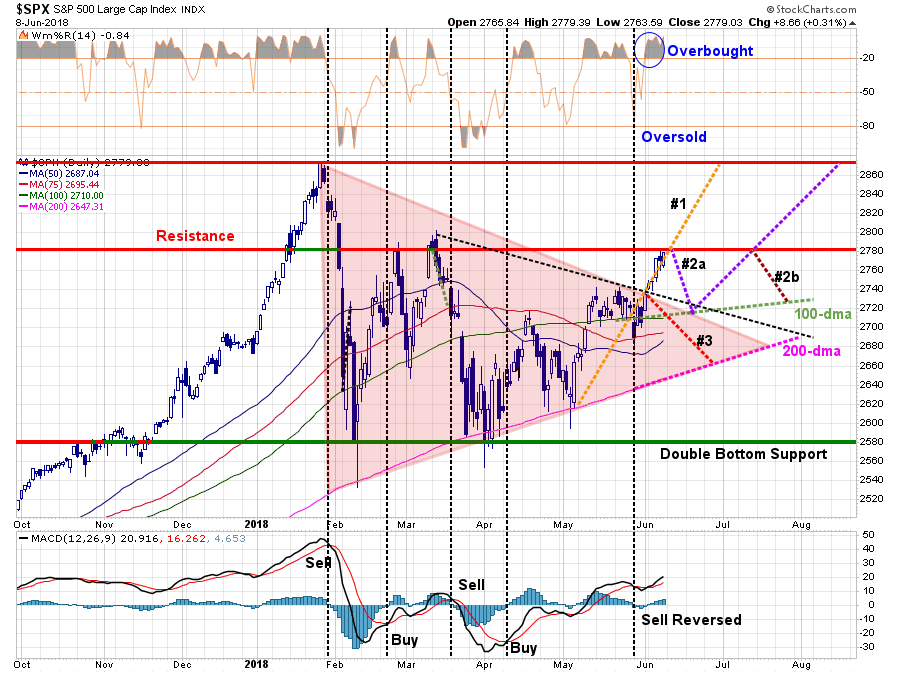
We had previously given pathway #1, #2a and #2b a 70% probability of coming to fruition. The tracking of pathway #1 also negates pathway #3 entirely for now.
More importantly, the market is sitting at the critical juncture of either a continuation of pathway #1 toward all-time highs, or a correction of some sort to retest support and confirm this past week’s breakout. A corrective retest that provides a better entry point to increase exposure is the most preferable of outcomes.
There are plenty of catalysts next week to provide the markets the necessary catalyst for a short-term sell-off.
- The Fed will hike rates next week, however, their press conference will be closely watched for more “hawkish” undertones.
- Next week, the Trump Administration will announce $50 billion in “tariffs” on Chinese products. The ongoing trade war remains a risk to the markets in the short-term.
- Any unexpected “back-of-the-napkin” policy the White House takes which surprises the market.
- Ongoing liquidity concerns with respect to Italy or Deutsche Bank.
For now, the market has “priced in” most of the “known” risks to some degree. What hasn’t been “priced in” is unexpected economic weakness, a credit related event, or a new geopolitical risk currently not on the horizon. These things happen, and while the current backdrop is very positive for stocks currently, not paying attention to the risks has very negative consequences.
Adding Exposure
As we have noted previously, it is the “end of the week” data which drives our portfolio allocation models and strategy. Using weekly data reduces the “volatility” of the day-to-day price movements and reduces both emotional mistakes and portfolio turnover. As longer-term investors, we are more interested in overall market trends rather than short-term trading victories.

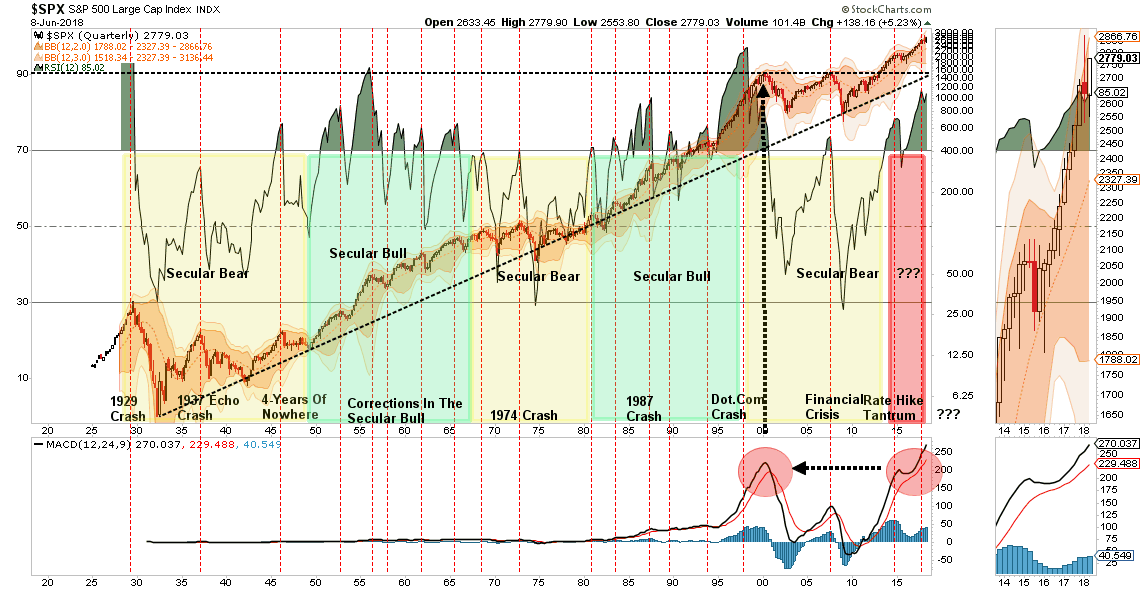
This past week the market cleared the 61.8% Fibonacci retracement from the recent lows which removes a major barrier in reaching previous market highs.
Also, the market held to its accelerated “bullish trend line” from the 2015 lows. Despite the recent corrective action, nothing “bearish” has occurred which is why we only mildly reduced our overall equity exposure. The break above resistance this past week, now allows us to additional increase exposure in portfolios further.
A Word Of Caution
There are only a couple of issues at the moment which keep us mildly heavier in cash. The sharp rise in asset prices this past week, as shown above, was due to a massive “short squeeze” in equities. It was particularly seen on Friday in the most beaten down sectors of retail and staple stocks that have roared back to life. The rally could well be short-lived given the underlying fundamentals that plague these sectors currently has not changed.
Secondly, the weekly “sell signal” has not been reversed as of yet. While the signal will likely be reversed in the next week or so, if the markets continue to advance, it is worth giving the signal the “benefit of the doubt” currently. If you go back and look at the 2015-2016 correction process, which was ended by massive globally coordinated Central Bank interventions, the weekly signal turned positive for a few months before failing into the next correction.
Currently, we do not have globally coordinated Central Bank interventions occurring, rather they are withdrawing their support. The Fed is about to ramp up their balance sheet reductions from $30 to $40 billion a month pulling further liquidity from the markets. The ECB and Japan have also started tapering back.
Also, as Zerohedge discussed on Friday:
“Over the past month, US Investment Grade credit has steadily underperformed its corresponding equities, punctuated by a significant credit widening yesterday. Despite CDX IG 5Y widening 3bps yesterday afternoon to 67bps, there was little SPX reaction and only a modest rise in the VIX. “


Benchmarking the divergence:
“We estimate the equities corresponding to the names in the CDX IG Series 30 are up 3.5% in the past month while a risk equivalent investment in CDX IG 5Y is down 2.8% (selling protection at 12x hedge ratio).
Relative to volatility over the past year, credit has underperformed equity by 3.1 standard deviations over the past 2, 4, 6 and 8 weeks when compared to these same rolling periods over the past year.
This compares to a 2.7 standard deviation dislocation when we last wrote about a similar divergence in January.”
What might this mean for forward equity returns?
“Over the past year, when credit has underperformed equity by an average of 1 standard deviation over a 2, 4, 6 and 8 week period (12% of observations), equity was down an average of -2.3% over the subsequent month. When credit OUTperformed equity by more than 1 standard deviation over a 2, 4, 6 and 8 week period on average (8% of observations), equity was up an average of 2.4% over the subsequent month.”
Goldman’s suggestion:
“We see this difference as significant and leads us to favor de-risking strategies in equities.”
I don’t disagree with Goldman’s analysis, which begs the question “why increase equity exposure further?”
It’s a good question.
The answer is simple, because our strategy, discipline, and models require us too.
There is a more than reasonable risk the markets could well rally to all-time highs only to fail once again.
While the “bulls” will be quick to suggest the markets are set to run indefinitely higher, the reality is that we remain very late in the current cycle, rates are rising, liquidity is being extracted and valuations are elevated. While any one of those issues has proved problematic for stocks in the past, the combination of all of them are a toxic brew longer-term. This is particularly the case with a market that is at extremes rarely seen in market history.
While we will begin slowly increasing our exposure to equities back to target allocations starting next week, we do so with a risk-management process in place.
We encourage you to do the same.
If you don’t have one, it might be time to develop one.
Are You Being “Shamed” Into Excess Risk?
by John Coumarionos
How an advisor should talk to clients and what rhetoric leads to big sales are often at odds. It can be death to an advisory business if the advisor is negative. Although this isn’t universally true, clients tend to want reassurance from an optimistic advisor. That’s why economist Andrew Smithers refers to broker happy talk as “stockbroker economics.” The two rules of stockbroker economics are:
1. All news is good news, and;
2. It’s always a good time to buy stocks.
On the role of news, a strong economy fills clients will all the optimism and willingness to buy what they need. A weak economy simply prompts a broker to say that falling interest rates and future rising profits are good for stocks, never mind that profits and prices had only moved in tandem 54% of the time when Smithers wrote his 2006 article. On the second rule, nothing has succeeded as well as what Smithers’ calls the “bond yield ratio,” another name for which is the “Fed Model.” That model compares bond yields to the earnings yield of the stock market (the reciprocal of the P/E ratio or E/P). This ratio worked from 1977 to 1997, but didn’t from 1948 to 1968. Using the full dataset shows no relationship between bond yields and earnings yields, according to Smithers.
Other forms of nonsense used to support the second rule include using a current P/E ratio to appraise stocks. Of course, a current P/E ratio has little ability to forecast long-term returns. It sometimes shows stocks are expensive when they are actually cheap, and vice versa.
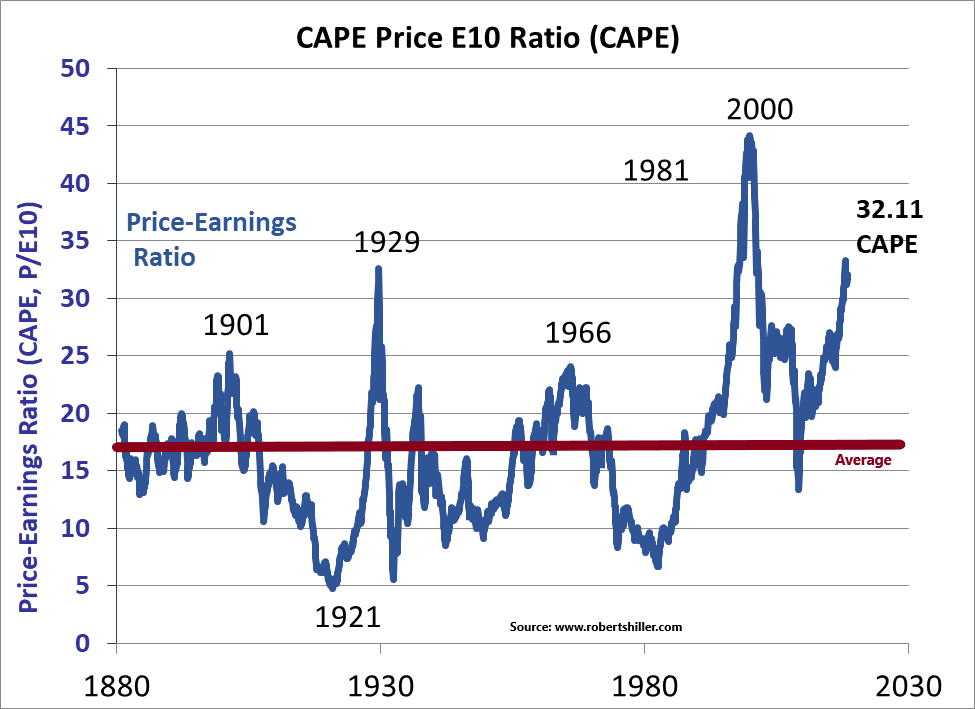
A third piece of nonsense that Smithers doesn’t mention is the assertion that all forecasting is bunk. But while forecasting next year’s returns might be bunk, metrics like the Shiller PE and Tobin’s Q have strong records in forecasting future long-term returns. Even if the Shiller PE has been elevated for the past 25 years, the S&P 500 Index has delivered tepid returns (5.4% annualized) from 2000 through 2017.
All of this means the first rule for investors judging their advisers is whether their advisers engage in too much happy talk – especially about future returns. If an adviser says a balanced portfolio should deliver a 7% annualized return for the next decade with starting 10-year U.S. Treasury yields at 3% and stocks at a 32 CAPE, be wary.
Second, investors should avoid advisers who avoid making forecasts to the point where they disparage anyone who does. That’s because it’s not hard to make a bond forecasts. With high-quality bonds, yield-to-maturity will get you close to the total return. Although stocks are harder, the Shiller PE can help, and the more it’s stretched by historical standards, the more accurate it gets. No adviser should be dogmatic about pinpointing future returns; anyone who thinks they can be precise is crazy. But it’s also outlandish to expect long-term historical returns from the stock market when valuations are as stretched as they are today. Stock market forecasts are hard, but don’t let your adviser squirm out of them completely.
Making a forecast is also necessary for constructing a financial plan. And while it’s true that an accurate forecast doesn’t have to be available just because advisers and clients need one, decade-long projections are easier, if imperfect, than guessing what next year’s market move might be. And when the Shiller PE stretches to more extreme levels, low future returns become more likely. When you hear an adviser making fun of something, that should raise warning flags.
We think advisers with integrity aren’t afraid to tell clients stocks are expensive even when it might hurt the adviser’s business. An adviser constructing a financial plan owes you an honest assessment about future returns. Currently, the Shiller PE is at 32. And while nothing is impossible, it’s very unlikely that stocks will deliver more than a 2% real annualized return for the next decade.
Third, consider if your adviser goes beyond the risk questionnaire he gives you. Nearly every financial advisory firm has a risk questionnaire that it gives to prospects and clients. The questionnaire often has many questions about how much risk the investors think they can handle and what portion of their assets they’d like to put at risk in exchange for possibly getting a higher return than a low-risk investment will deliver. But risk questionnaires ask about percentages, and most people don’t think in percentages. Consider if your adviser asks you how you might feel if you opened up your statement and your account was down by a certain dollar amount. That’s more meaningful than a percentage question. Consider it a positive thing if your adviser pursues this line of questioning a bit, including asking you how you felt and how you reacted to the market plunge in 2008.
Risk often boils down to how much of a portfolio decline a client can tolerate before selling out. This is important because it shows how investors do themselves damage. The tendency should be to buy stocks when they get cheaper, not sell them. But investors rarely think of buying when the prices of their holdings are declining.
Advisers have other ways of trying to train clients about how to treat price declines in their portfolios. Many advisers focus on long term asset class returns, trying to persuade investors that they can overcome declines if they have the willpower to stay the course and not be discouraged. Other advisers do the opposite, focusing on how severe declines can be and trying hard to get clients into allocations that they can live with at the outset and to prepare them for the difficulty that lies ahead in the inevitable downturns.
The advisers who emphasize long-term returns often come close to shaming clients into owning stocks. In my experience, that has made some clients feel inadequate for not wanting to assume more risk – or have encouraged clients to take more risk than they would have for fear of being deemed inadequate in the eyes of the adviser.
Make sure your adviser isn’t shaming you into owning more stocks than you’d like.
Market & Sector Analysis
Data Analysis Of The Market & Sectors For Traders
S&P 500 Tear Sheet

Performance Analysis
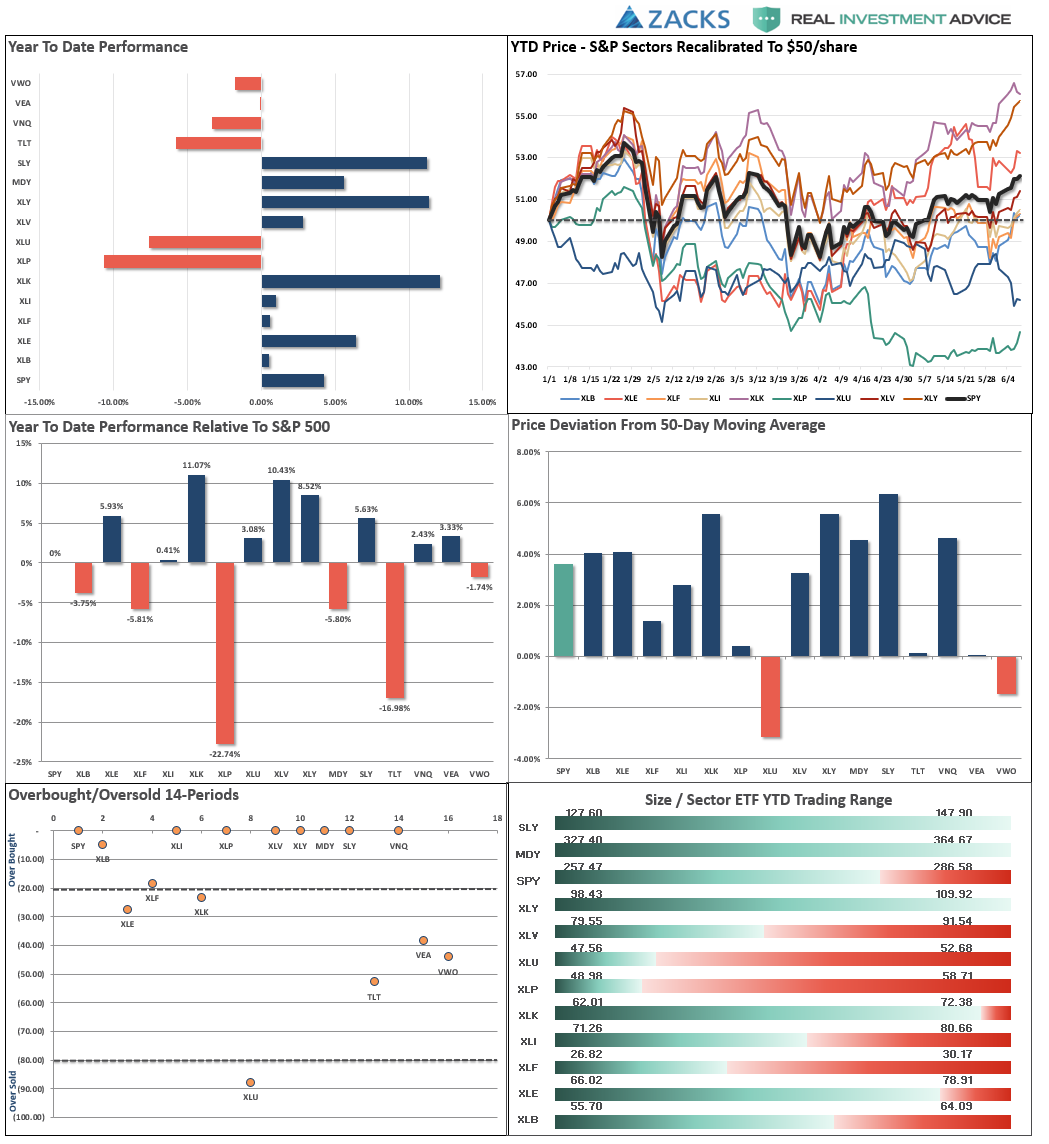
ETF Model Relative Performance Analysis

Sector & Market Analysis:
As noted above, the consolidation continues. As earnings season comes to its conclusion, the market will turn its focus to the economic and geopolitical backdrop which has been less optimistic as of late. We remain invested but our caution levels remain elevated.
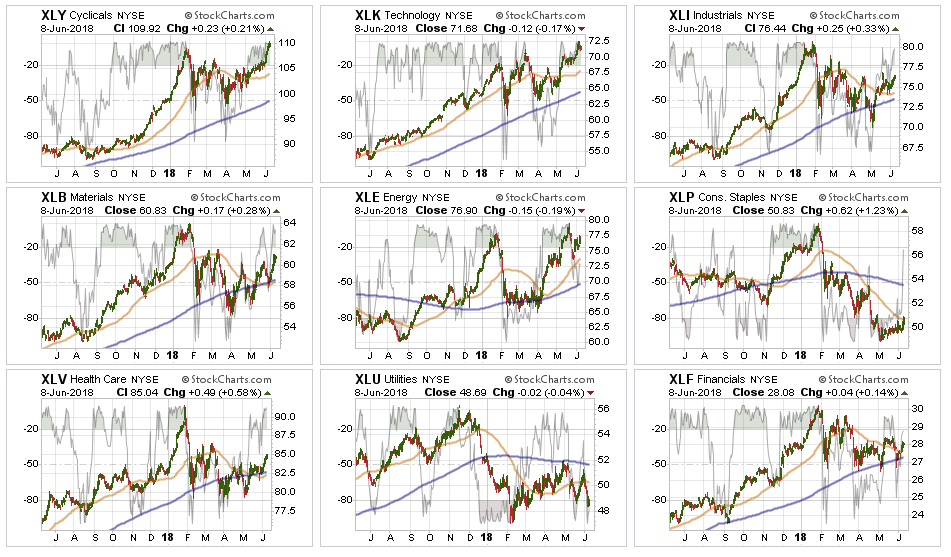
Discretionary, Technology, Healthcare, Financial, Industrial, and Material stocks led the charge last week as money rushed back into equities following the break out of the ongoing consolidation range over the last couple of months. The most heavily shorted stocks turned in the best performance, but despite the improvement in the “breadth” of the overall rally, volume declined.
Energy also picked up that pace after its recent stumble as oil prices recovered a little bit. While the sector is still performing well, keeping current allocations at market weight, there is still some concern with recent price action given the previous two tops. We continue to suggest harvesting some profits if you haven’t done so as it is possible we not done with the correction just yet, particularly if the dollar continues to strengthen.
Staples finally showed some signs of life last week as money rotated into the most beaten up, and heavily shorted, areas of the market. We want to see some follow through over the next week before increasing exposure to the sector, but we are getting much more interested.
Utilities continue to languish at this point and are deeply oversold. We remain out of the sector for now, and we need some confirmation of sustainability before adding exposure back into portfolios.
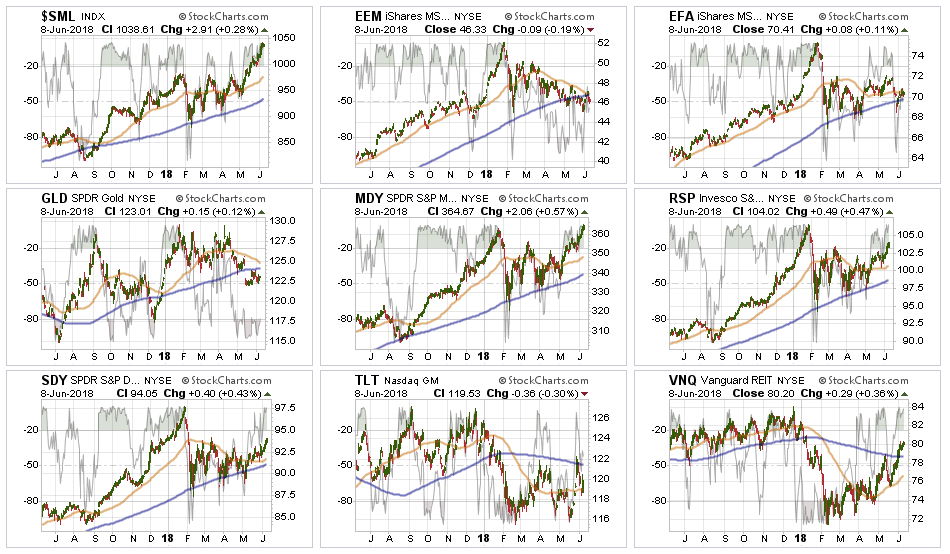
Small-Cap and Mid Cap continue to lead performance overall. After small caps broke out of a multi-top trading range, we now need a pull-back to add further exposure. Mid-cap stocks also followed through last week breaking out to all-time highs as well. Any pullback that doesn’t violate support will also provide a better opportunity to increase exposure. After a strong push over the last few weeks, rebalance back to core weightings and look for a more opportunistic entry point in the future.
Emerging and International Markets remain lackluster in terms of performance currently. We previously removed our holdings in these markets and remain domestically focused at the moment. We will continue to monitor performance for an opportunity if it presents itself. Emerging markets, in particular, continue to lag due to a rising dollar and weak economic growth globally. Industrialized International is performing better, but not by much. Remain domestically focused to reduce the drag on overall portfolio performance.
Dividends and Equal weight continue to hold their own and we continue to hold our allocations to these “core holdings".
Gold as noted previously, gold failed to hold important support at the 200-dma. We currently do not have exposure to gold, we exited in 2013, and see no evidence to suggest a long-term holding opportunity is at hand. We previously suggested to“Take profits on positions, and lower your stop to last week’s bottom at $122.” Again, we see no reason currently to own gold in your portfolio. There is no “fear” in the financial markets currently to cause a flight to safety. There will come a time to own gold, and we will add it heavily to portfolios when such is the case.
Bonds and REITs – Bonds continue to hold there own and remain a flight to safety when things “blow up,” as we saw with Italy recently. This is WHY we own bonds. While “exuberance” has overtaken “risk” in the short-term, the longer-term problems clearly remain. We remain out of trading positions currently, but remain long “core”bond holdings mostly in floating rate and shorter duration exposure. REIT’s are much more interesting now with a break back above their 200-dma. With the sector back on a “buy signal” short-term we will look for an opportunity to add REIT’s back into our portfolios.
The table below shows thoughts on specific actions related to the current market environment.
(These are not recommendations or solicitations to take any action. This is for informational purposes only related to market extremes and contrarian positioning within portfolios. Use at your own risk and peril.)

Portfolio/Client Update:
The break out of the consolidation last week provides us with the ability to opportunistically step up our equity allocations across all models. As I noted several weeks ago, we increased exposure in all models when the market initially broke out above the 100-dma. With the breakout above consolidation last week, we will now look for an entry point to add to portfolios.
- New clients: Will will look to buy 50% of target equity allocations for new clients.
- Equity Model: We previously added 50% of target allocations. Those positions will be “dollar cost averaged” opportunistically. (By the way, this is the proper way to “dollar cost average.”)
- Equity/ETF blended models will be brought closer to target allocations. We will add to “core holdings” to replace international and emerging markets deletions.
- Option-Wrapped Equity Model will be brought closer to target allocations and collars implemented.
We will do this opportunistically and continue to work to minimize risk as much as possible. While market action has improved on a short-term basis, we remain very aware of the long-term risks associated with rising rates, excessive valuations and extended cycles.
The actions we are taking currently are simply to take advantage of the current bullish reversal. We will also unwind these positions either by reducing, selling, or hedging if the market environment changes for the worse.
THE REAL 401k PLAN MANAGER
The Real 401k Plan Manager – A Conservative Strategy For Long-Term Investors

There are 4-steps to allocation changes based on 25% reduction increments. As noted in the chart above a 100% allocation level is equal to 60% stocks. I never advocate being 100% out of the market as it is far too difficult to reverse course when the market changes from a negative to a positive trend. Emotions keep us from taking the correct action.

Add Exposure Slowly
Finally, a breakout.
With weekly “sell signals” still in place, I am not going to increase the allocation model just yet. We are running into resistance and have a ways to go before breaking out to new highs which would reconfirm the ongoing bullish trend.
Over the last several weeks we have been recommending the following actions:
- If you are new to reading the newsletter or have NOT taken any previous actions or are overweight equities in your plan – Do nothing.
- If you are slightly underweight equities in your plan – move to the RISK ADJUSTED allocation model.
- If you are very underweight equities in your plan – move 50% of the way toward the RISK ADJUSTED model.
At this point the rules change slightly:
- If you are overweight equities – do nothing.
- If you are underweight equities – move to target allocations.
- If you are at target equity allocations currently, you can add further exposure on any weakness in the market which does NOT violate previous support levels.
- i.e. Move from 45% equity exposure to 50%.
I know, it’s boring. But “baby steps” are always the best course of action. There remains the risk we are in a broader topping process, or some unexpected event could quickly reintroduce “risk” back into the markets. Small steps let us adjust accordingly without being emotionally driven which leads to bigger mistakes.
.
Current 401-k Allocation Model
The 401k plan allocation plan below follows the K.I.S.S. principle. By keeping the allocation extremely simplified it allows for better control of the allocation and a closer tracking to the benchmark objective over time. (If you want to make it more complicated you can, however, statistics show that simply adding more funds does not increase performance to any great degree.)
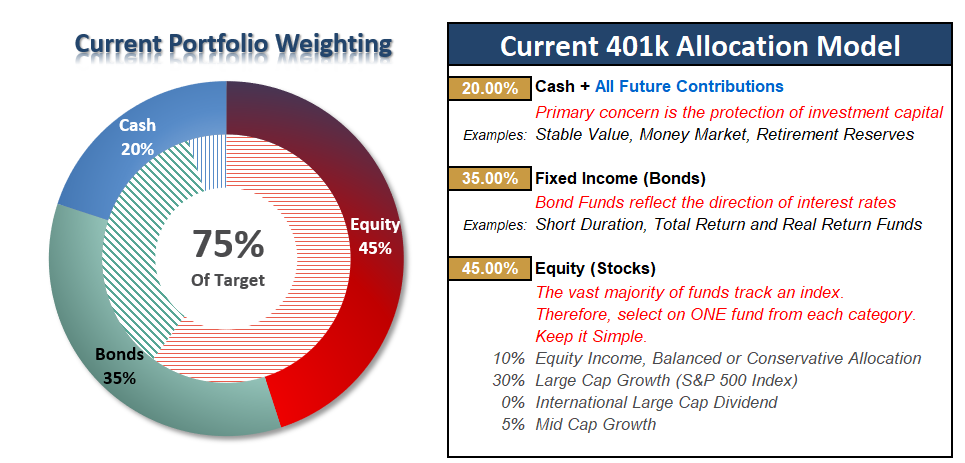
401k Choice Matching List
The list below shows sample 401k plan funds for each major category. In reality, the majority of funds all track their indices fairly closely. Therefore, if you don’t see your exact fund listed, look for a fund that is similar in nature.
Disclosure: The information contained in this article should not be construed as financial or investment advice on any subject matter. Real Investment Advice is expressly disclaims all liability in ...
more

