

Image Source: Pixabay
As of June 5th, 10yr-3mo reinverts.
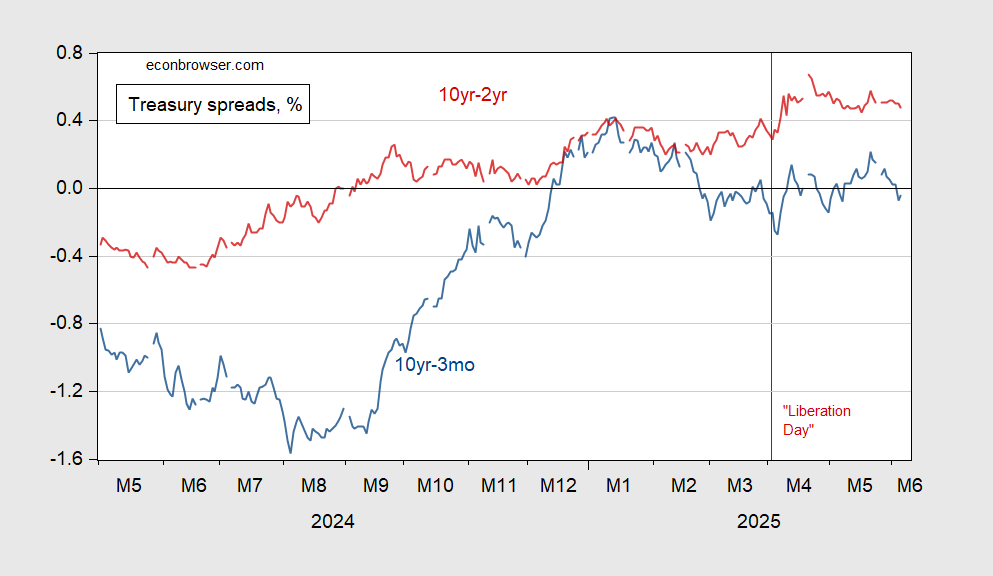
Figure 1: 10yr-3mo Treasury spread (blue), and 10yr-2yr Treasury spread (red), both in %. Treasury via FRED.
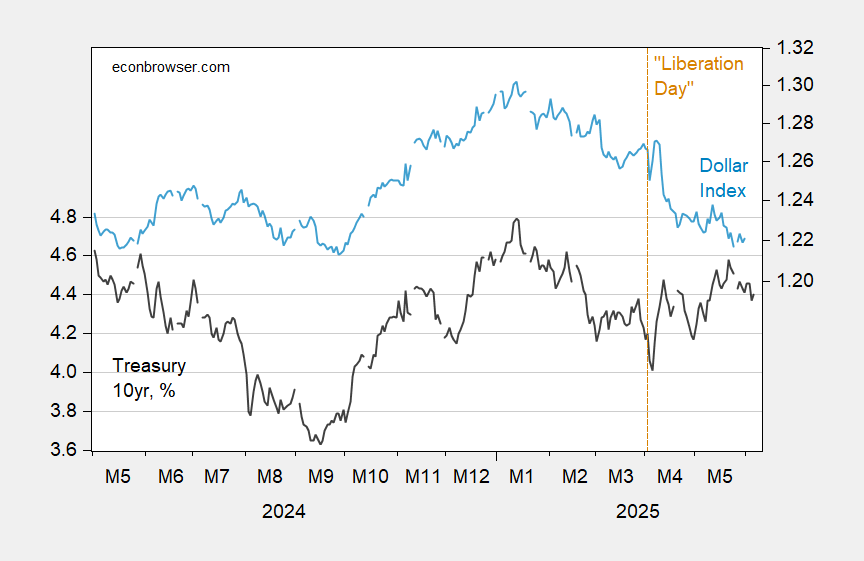
Figure 2: Treasury 10 year, % (black, left scale), and broad dollar index (light blue, right scale). Source: Treasury, Federal Reserve via FRED.
The dollar has continued to depreciate since 5/29 (last observation on the dollar), by the DXY, another 0.5% as of 6/5.
My interpretation: the GDP outlook is looking less bright, and probably less so than indicated by historical correlation, given the elevated credit risk now implicit in Treasurys (see here). Moreover, continued dollar decline is to be expected as Treasury rates decline.
More By This Author:
Weekly Indicators Using Data Releases Thru 5/31GDPNow Bounceback (Kind Of)
Trump Predicts At Least 3% Growth


Comments
Log in or sign up to join the conversation.