

Image Source: Pexels
As measured by Baker, Bloom and Davis’s EPU. I was in Europe, and conversations were in high gear about how things now seemed. And text mining confirms:
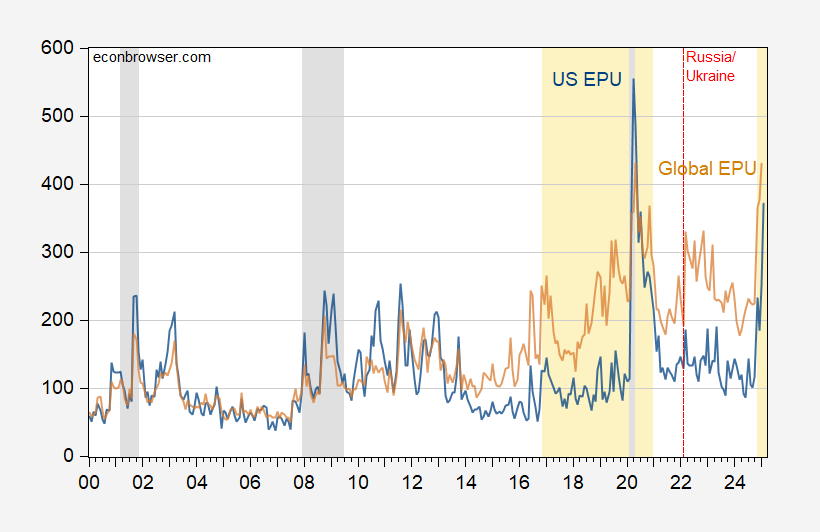
Figure 1: US EPU (blue), Global EPU (GDP weighted at market exchange rates) (brown). Orange denotes periods from election to end-Trump administration. NBER denoted peak-to-trough recession dates shaded gray. Source: policyuncertainty.com, and NBER.
Global EPU in January matches EPU in May 2022.
More By This Author:
EPU And Expected InflationThe Russian Economy: How Many Contingent Liabilities?
Economists, Some Consumers, Believe Y/Y Inflation Will Rise


Comments
Log in or sign up to join the conversation.