Output: Where We’ve Been And Where We Are Relative To Potential
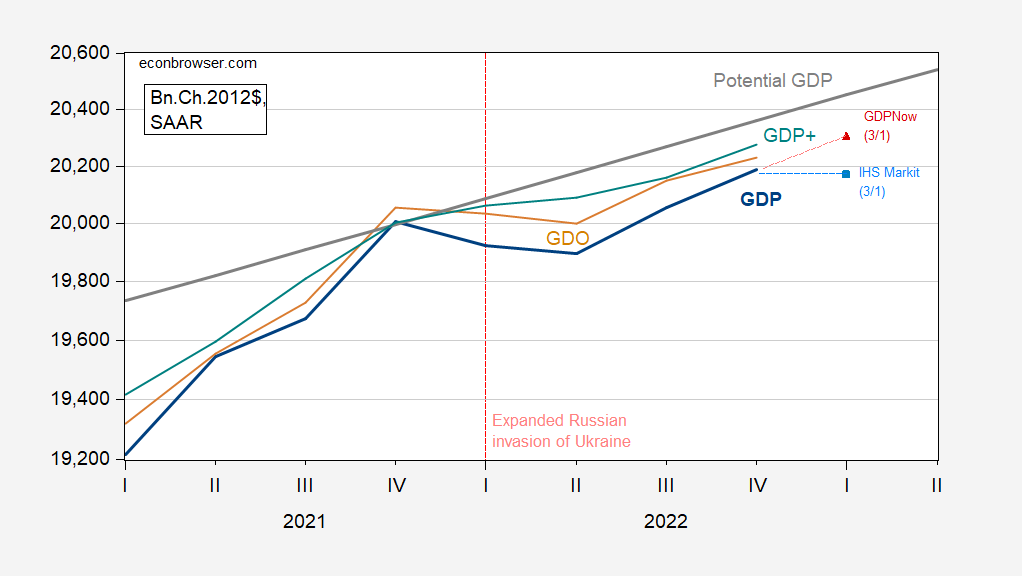
We have a 2nd release for GDP, and nowcasts for Q1. We also have GDP+ and a guess for GDO for Q4. This is the picture, taking CBO’s estimate of potential GDP.
Figure 1: GDP (blue), GDO (tan), GDP+ (teal), nowcast from Atlanta Fed (red triangle), and IHS Markit/S&P Global (sky blue square), and potential GDP (gray line), all in billions Ch.2012$ SAAR. GDO estimate holds enterprise surplus in GDI constant at nominal 2022Q3 levels. GDP+ cumulates growth rates onto 2019Q4. Source: BEA 2nd release, Philadelphia Fed, Atlanta Fed (3/1), S&P Global (3/1), CBO Budget and Economic Outlook, February 2023, and author’s calculations.
Interestingly, even estimates of robust economic growth, such as in the Atlanta Fed’s GDPNow estimate of 2.3% q/q SAAR for Q1, fail to substantially close the estimated output gap.
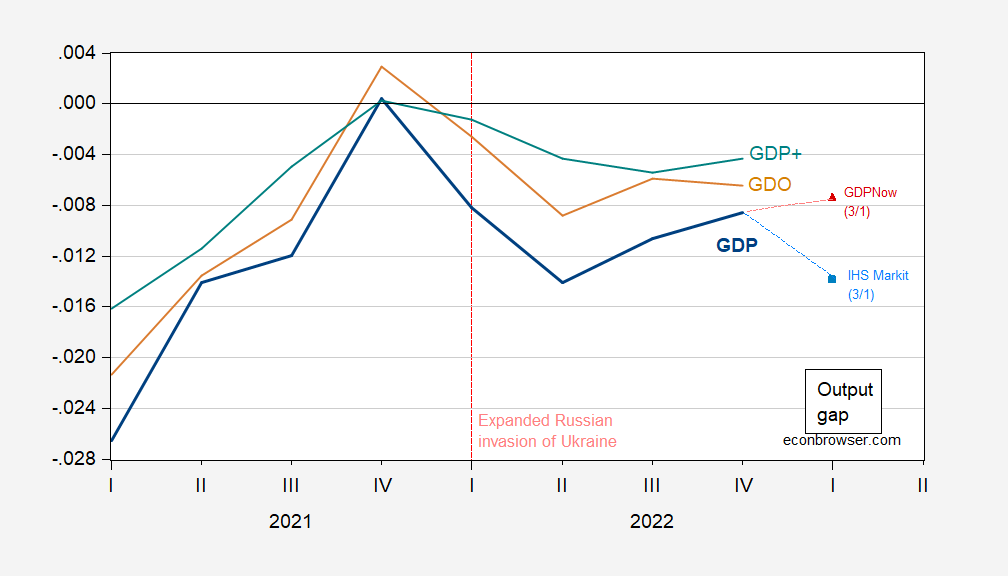
It is interesting to observe that the output gap went negative with the shock induced by the expanded Russian invasion of Ukraine in February 2022.
Figure 2: Output gap implied by GDP (blue), GDO (tan), GDP+ (teal), nowcast from Atlanta Fed (red triangle), and IHS Markit/S&P Global (sky blue square). GDO estimate holds enterprise surplus in GDI constant at nominal 2022Q3 levels. GDP+ cumulates growth rates onto 2019Q4. Source: BEA 2nd release, Philadelphia Fed, Atlanta Fed (3/1), S&P Global (3/1), CBO Budget and Economic Outlook, February 2023, and author’s calculations.
The output gap as of 2022Q4 is between -0.4 and -0.8 percentage points of GDP, depending on measure. IHS Markit/S&P Global sees a recession coming in 2023, with its nowcast indicating a widening of output gap even as nowcasted growth is only slightly negative in Q1 (at -0.3% annualized).
More By This Author:
If The Housing *Is* The Business Cycle, What Does This Picture Mean?Business Cycle Indicators As Of March 1st
Seasonal Adjustment In The Wake Of Big Shocks, Economic And Otherwise


