
/Jen-Hsun%20Huan%20NVIDIA's%20Founder%2C%20President%20and%20CEO%20by%20jamesonwu1972%20via%20Shutterstock.jpg)
by jamesonwu1972 via Shutterstock
Nvidia, Inc. (NVDA) stock looks at least 22% too cheap here, based on its strong free cash flow (FCF) margins (i.e., using a 39% FCF margin) and using a 2.0% FCF yield valuation metric. Put premiums are high, making shorting out-of-the-money puts attractive.
NVDA closed at $188.15 on Friday, Nov. 7, off its recent peak of $206.88 on Nov. 3. But it could be worth as much as $230 per share, or over 22% higher, based on its strong FCF. This article will show why.
(Click on image to enlarge)
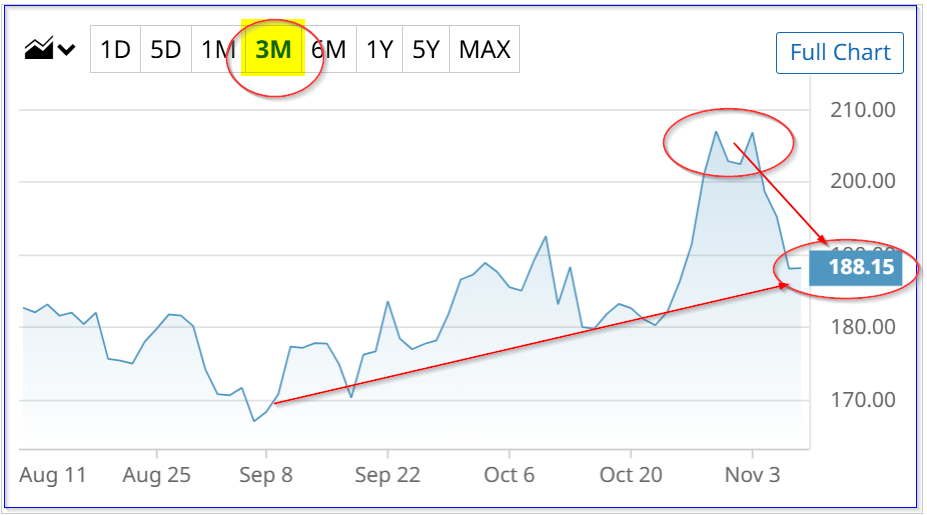
NVDA stock - last 3 months - Barchart - Nov. 7, 2025
Strong FCF Margins and FCF Projections
For the quarter ended July 27, 2025 (fiscal Q2), Nvidia generated $13.45 billion in free cash flow on $46.743 billion in revenue. That works out to a quarterly FCF margin of 28.8%.
In the past three quarters, according to Stock Analysis, its FCF margins were: 59.43% (Q1), 39.54% (Q4 2024), and 47.93% (Q3 2024).
That means its trailing 12 months (TTM) FCF margin has averaged 43.9%. We can use that to estimate its FCF going forward.
For example, let's assume that over the next 12 months (NTM), the FCF margin will be just 39%. Here's why.
If Nvidia makes a similar Q3 (with its upcoming release of earnings on Nov. 19) FCF margin of 29% as in Q2, its TTM margin will be as follows:
Q3 ….. 29.0%, Q2 ….. 28.77%, Q1 ….. 59.43%, Q4 2024 …. 39.54%
TTM Average as of Q3: 39.15%
So, to be conservative, let's use a 39.0% FCF margin for the next 12 months (NTM). For example, analysts now project that revenue for the year ending January 2027 will be $287.24 billion:
0.39 x $287.24 billion = $112.02 billion FCF NTM
We can use that to set a price target, using a FCF yield metric.
Price Target for NVDA Using FCF Yield
This metric assumes that 100% of FCF is paid out to shareholders. What would the dividend yield be? Well, one clue is by dividing Nvidia's TTM FCF by its present market cap.
For example, according to Stock Analysis, as of Q2, it has generated $72 billion in TTM FCF, and Yahoo! Finance reports that Nvidia's market cap is now $4.581 trillion:
$72b / $4,581b = 0.159 = 1.59% FCF yield
So, just to be conservative, let's use a slightly worse FCF yield metric, say, 2.0%. That means, in theory, if Nvidia were to pay out 100% of its $112 billion in FCF next year as a dividend, the market yield would be 2.0%.
Where would that leave its market cap in the next 12 months (NTM):
$112b / 0.02 = $5,600 billion market cap NTM
In other words, its market cap would rise by 22%:
$5,600b NTM market / $4,581b mkt cap today = 1.2224 -1 = +22.24% upside
That implies that the target price (before any share buybacks) is 22.24% higher than today's price, or $230 per share:
1.2224 x $188.15 = $230.00 NTM price target
In other words, using conservative FCF margin and FCF yield assumptions, NVDA stock could be over 22% undervalued.
As a result, it makes sense to look for a good entry point. One way to do this is to sell short out-of-the-money (OTM) put options.
Shorting OTM NVDA Puts
Given the recent volatility in the market and NVDA stock, its put option premiums are higher than normal. That makes them attractive to short-sellers in order to set a lower potential buy-in point.
For example, the Dec. 12, 2025, expiry period shows that the $170.00 strike price put option strike price, which is almost 10% below today's price, has a very high midpoint premium of $4.60 per put contract.
That means a short-seller of these puts, after securing $17,000 in collateral, can earn $460 over the next month. That works out to a yield of 2.71% (i.e., $460/$17,000 = 0.0270588).
(Click on image to enlarge)
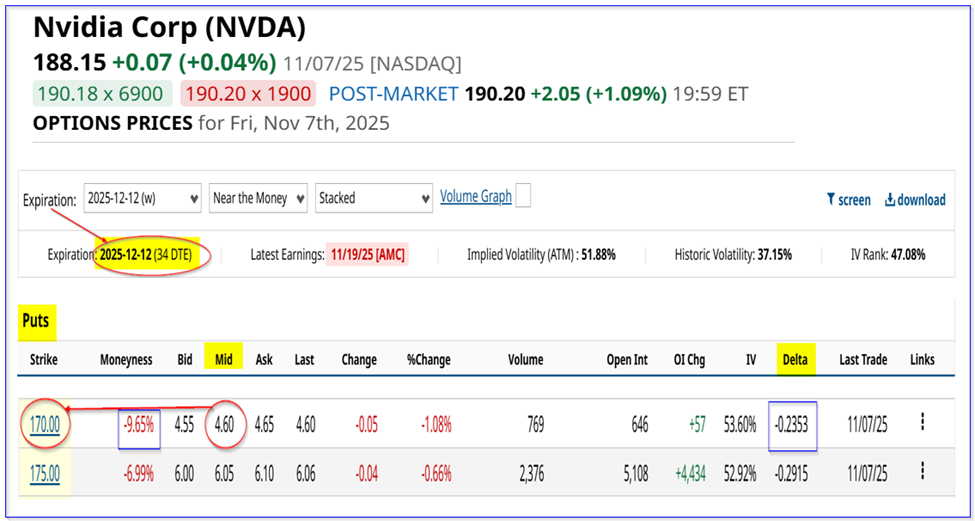
NVDA puts expiring Dec. 12, 2025 - Barchart - As of Nov. 7, 2025
This also sets a much lower potential breakeven point, even if NVDA falls 10% to $170.00 on or before Dec. 12:
$170.00 - $4.60 = $165.40 breakeven
That is 12% below or $22.75 lower than Friday's close. So, it provides a huge potential upside to a short-seller, assuming NVDA rises to $230.00 over the next 12 months:
$230.00 / $165.40 breakeven = 1.39 -1 = +39% upside
Moreover, for less risk-averse investors, shorting the $175.00 put option provides higher income, although the delta ratio is slightly higher (i.e., 29% chance of NVDA falling to $175.00, vs. 23.53% chance of it falling to $170.00).
For example, the yield is much higher with the premium at $6.05:
$6.05/ $175.00 = 0.03457 = 3.457% short-put yield over one-month
But the breakeven point is still low at $175.00 - $6.05, or $168.95, or -10.2% below Friday's close.
The bottom line here is that shorting out-of-the-money (OTM) puts like these two contracts provides a good yield and potential upside for new NVDA investors.
More By This Author:
Is McDonald's A Buy? Its Strong FCF Margins Imply MCD Could Be 23% Undervalued
Heavy Tesla Call Options Volume Highlights TSLA Stock's Value
Microsoft Produces Strong FCF As Expected - Shorting OTM Puts Is An Attractive Play

Comments
Log in or sign up to join the conversation.