Caution, DJIA Price At Premium To Value

Image source: Pixabay
Caution!
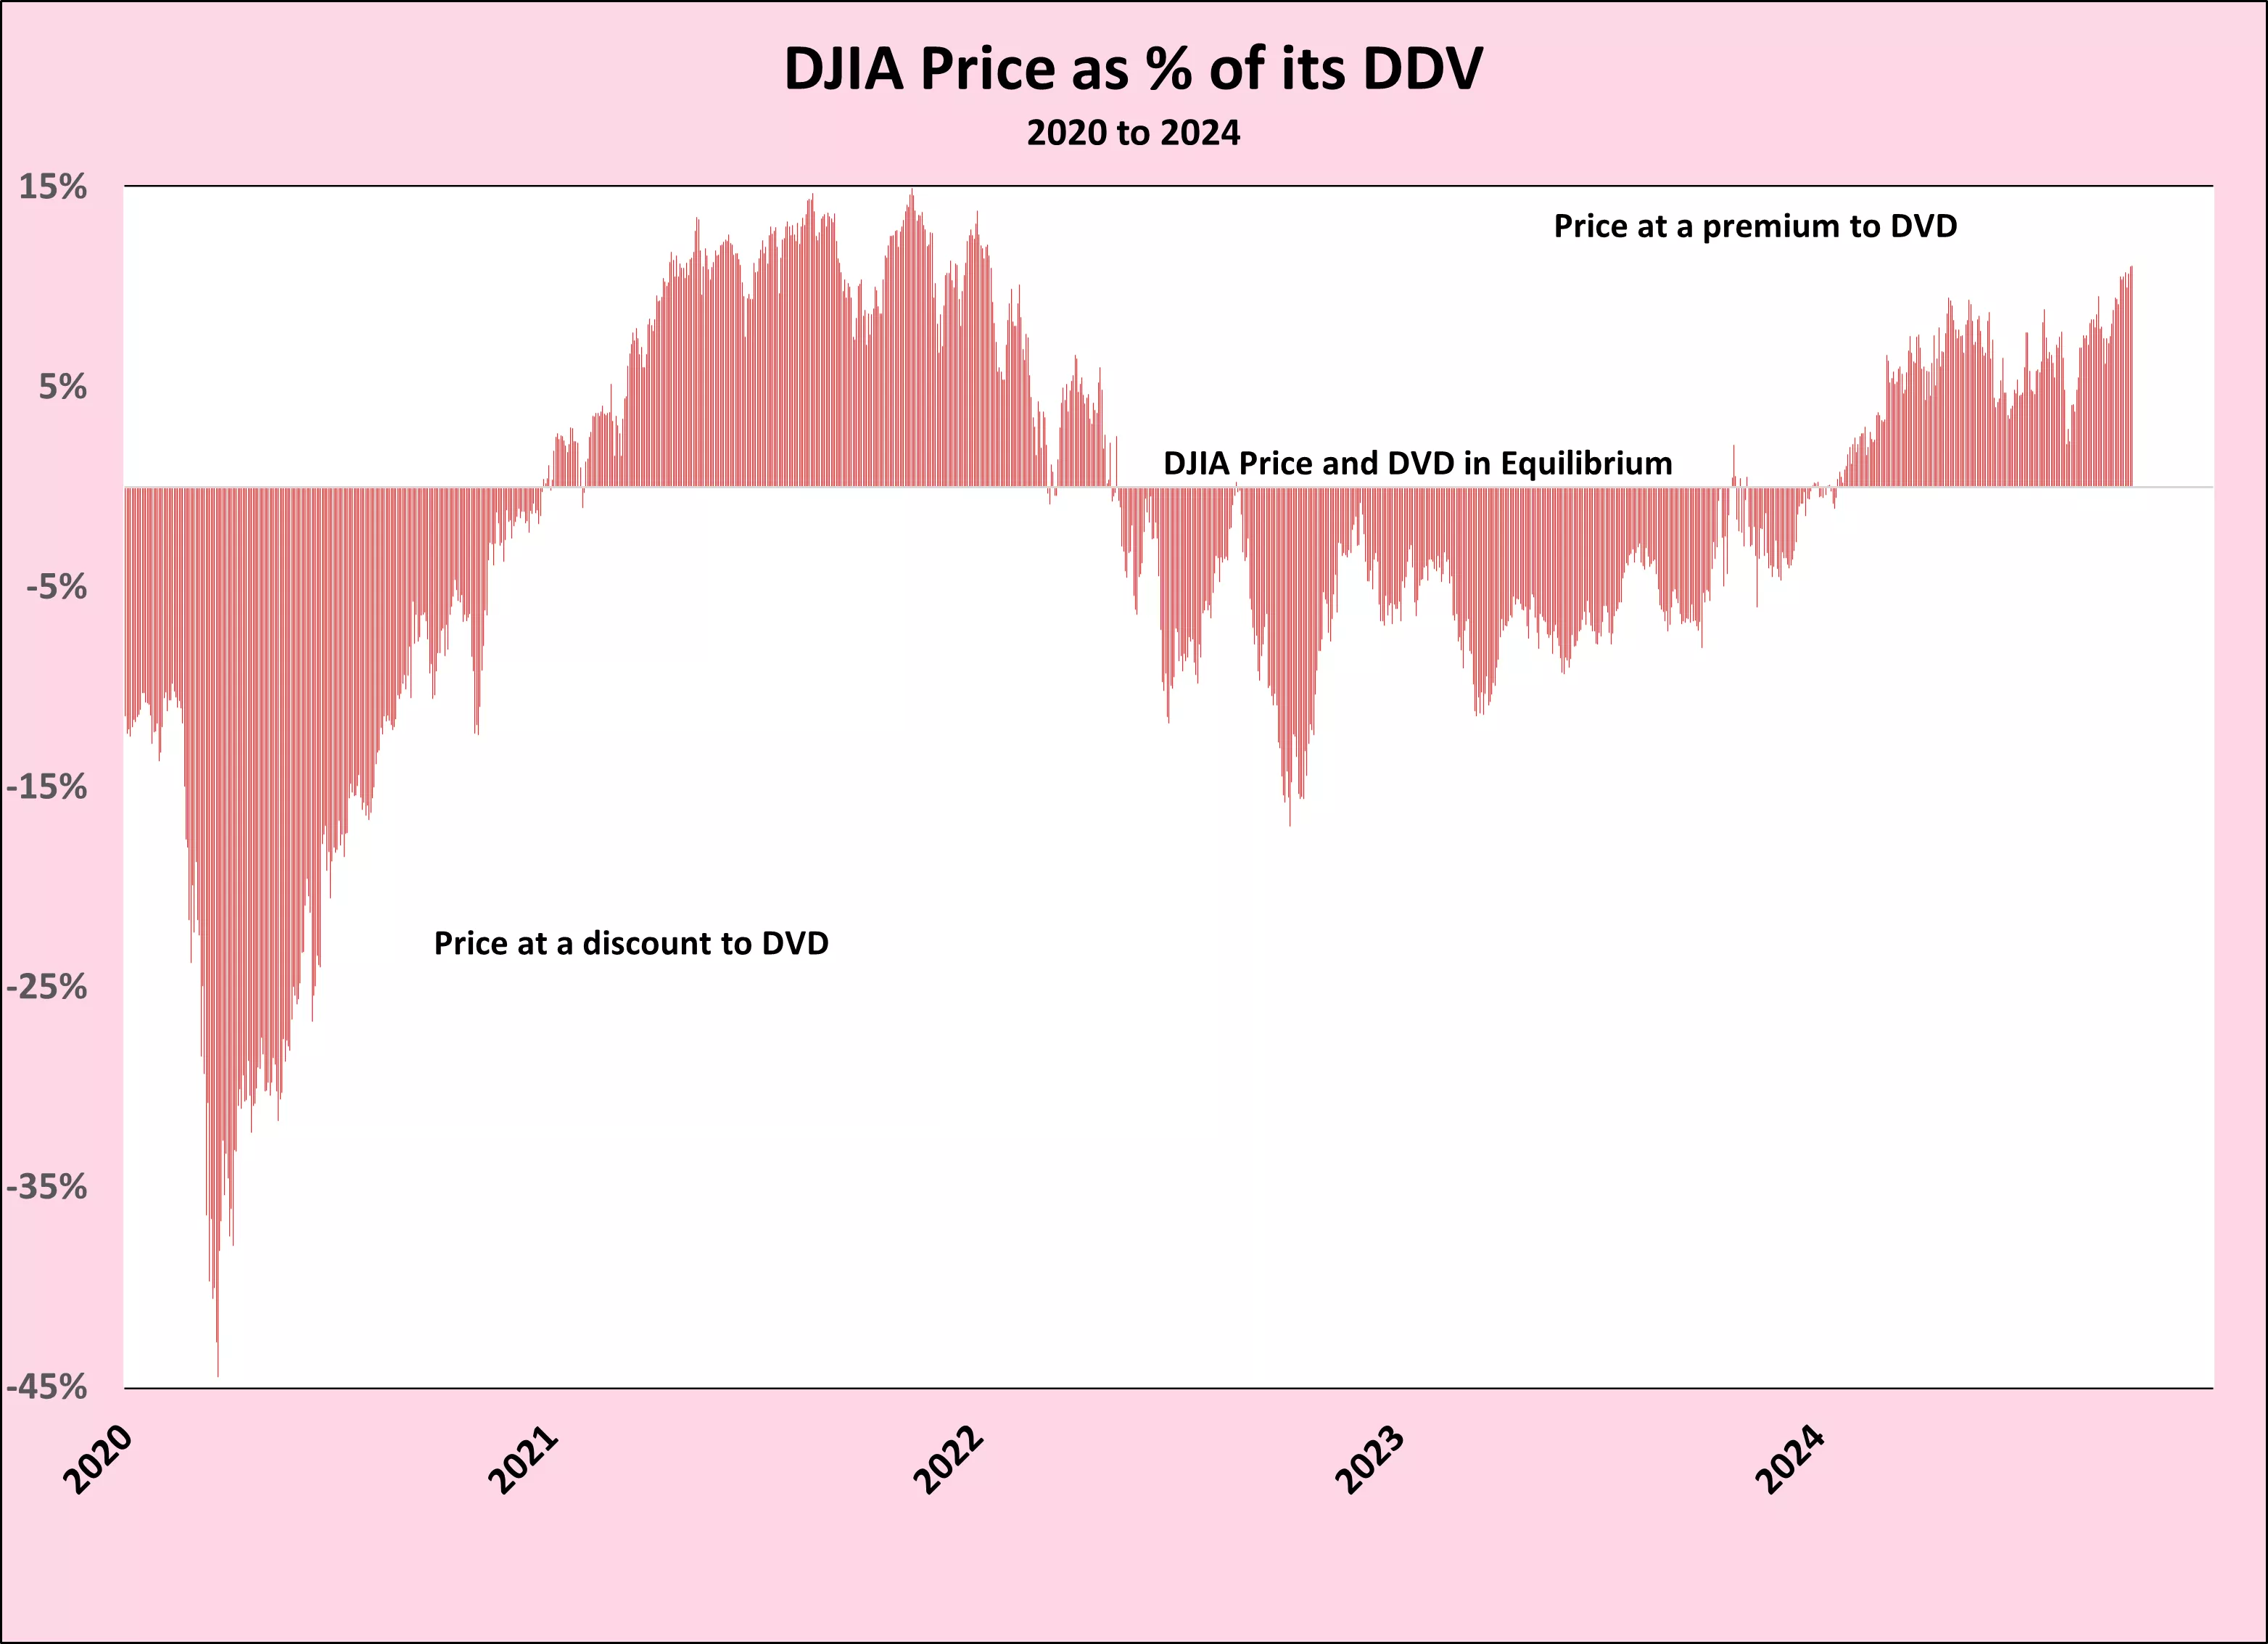
On September 30, 2024, the DJIA closed at a record 42,330, 11.1% above its record Dividend Discount Value (DDV) of 38,111. This post-Fed-cut euphoria has probably run its course, and the watchword should now be “Caution”.
There appears to be little incentive to buy an over-priced DJIA. The US economy may have a soft landing and avoid a recession, but it is too early to know. Hence, while the DJIA dividend with a payout ratio of only 46% is considered safe there could be reluctance by corporate boards to boost dividends until the economy and earnings start to pick up again.
The yield curve of the US Treasury market can move back from its flat state by either a sharp decline in the short end because of bad economic numbers, or a rise in the long end of the market. The yield on the 30-year T bond remains under 4.5% but could move back up as the yield curve steepens and the US Government needs to fund more of its ever-growing debt in the long end of the market from which it withdrew at the end of October 2023.
To the above, one must consider the potential outcome of the US election. As well as the funding of wars. Particularly, in Ukraine and the Middle East.
Suggested Action
Near-term there appears to be an opportunity to profit from selling covered call options.
This article is a follow-up to my last article on TalkMarkets: DDV Model Works; Forecasting T Bond Rates Is Problematic https://talkmarkets.com/content/bonds/ddv-model-works-forecasting-t-bond-rates-is-problematic?post=423404
Only two vectors matter in the DDV model
The two main vectors determining the DDV of the DJIA are the trailing 52-week dividend and the yield of the 30-year T bond with a minimum of 4.5%. Earnings have been far too volatile to use in a valuation model as can be seen in the following chart:

The Long View from 1981
The next chart shows how the DJIA dividend has risen and the yield of the 30-year T bond has fallen from its all-time high of 15.2% recorded on September 29, 1981.
The vectors that drove the price of the DJIA from 1981 until October 9, 2007, the peak of the DJIA just before Lehman and the Great Recession, were a rising dividend and a falling 30-year T bond.

Since Lehman, the 30-year T bond rate has been largely below 4.5% and has had little, or no, effect on the DDV. The heavy lifting of the DDV has been left almost entirely to the 156% rise in the dividend from $290.37 to $742.41 with only a small amount of help from the 0.37% drop in the 30-year T bond yield to the 4.5% minimum yield
The argument for selecting a minimum yield on the T bond of the 4.5% rate is, in short, a combination of the last British Consol rate of 2.5%, at a time of no inflation, plus the desired inflation rate of 2.0%. For a more detailed explanation please see my article published on September 26, 2023
DJIA Trouble Ahead As Thirty-Year T Bond Yield Breaks Above Modified 4.5% Minimum:
https://talkmarkets.com/content/stocks--equities/djia-trouble-ahead-as-thirty-year-t-bond-yield-breaks-above-modified-45-minimum?post=412805
The next chart compares the daily DDV with the closing price of the DJIA over the past 43 years. The relationship is causal with a correlation coefficient of 0.97. This is nothing short of astounding.

On September 30, 2024, the price of the DJIA closed at a record 42,330 and stood at an 11.1% premium to its DDV of 38,111. This begs answers to the following questions:
- Will the price of the DJIA correct back to or below its DDV of 38,111?
- Is the DJIA price discounting an 11.1% dividend hike of $81.67 to $824.08?
- Are we returning to the irrational enthusiasm of the latter half of the 1990s? •
- Will the refunding of US Debt push 30-year rates higher and the DVD down?
Caution seems to be called for as there appears to be no reason for the price of the DJIA to move higher over the next two to three quarters.

The Analysis Since 2007
Starting on October 9, 2007, the record peak of the DJIA price before the Great Recession, the 30-year T bond yield has remained below 4.5% for most of the period while the rising dividend was the driving force in the DDV model.

The rise in the T bond yield from 4.5% in mid-September last year to 5.11% in late October led to the 11.8% drop in the DDV from 37,101 to 32,717. Simultaneously, the price of the DJIA fell 7.1% from 34,907, which was already below its DDV at the time, to 32,418.

For most of the past 17 years, the price of the DJIA has been at a discount to its DVD. During two short periods in the 2020s, the price of the DJIA has been at a premium to its DVD in the later stages of COVID and the recovery from the same as well as the present.

The Charts Since the Start of COVID.
Magnifying the above charts shows what has happened since the start of COVID in 2020.
Dividends recovered nicely from 2020, while the 30-year T bond remained below the 4.5% minimum until the latter part of 2023 and had no impact on the DDV. From mid-September until the end of October 2023 the yield of the T bond rose 61 basis points to 5.11%. As it moved above the 4.5% minimum, this seemingly, small increase significantly impacted the DDV, lowering it to 32,717 while the DJIA price fell to 32,418.


As demonstrated, it only requires the yield of the 30-year T bond to move above 4.5% to impact the DDV and the price of the DJIA negatively should follow accordingly.
More By This Author:
DDV Model Works; Forecasting T Bond Rates Is Problematic
"Sell The Rally"
DJIA Trouble Ahead As Thirty-Year T Bond Yield Breaks Above Modified 4.5% Minimum


Good read, great charts. Thanks.