

Image Source: Pixabay
I try to avoid hyperbole, but I don’t think it’s an exaggeration to say that Nvidia (NVDA) earnings are the most consequential report of any given quarter.It is no coincidence that the recent bull market run started in late 2022, almost exactly coinciding with the release of ChatGPT. Enthusiasm about artificial intelligence has been powering tech stocks, and thus the US market, ever since.And no stock has epitomized the AI gold rush more than NVDA.
Quite frankly, if any company has deserved this much attention, it’s NVDA. The fundamentals, some of which are portrayed below, paint a truly astounding track record of growth and profitability:
NVDA Selected Fundamentals
(Click on image to enlarge)
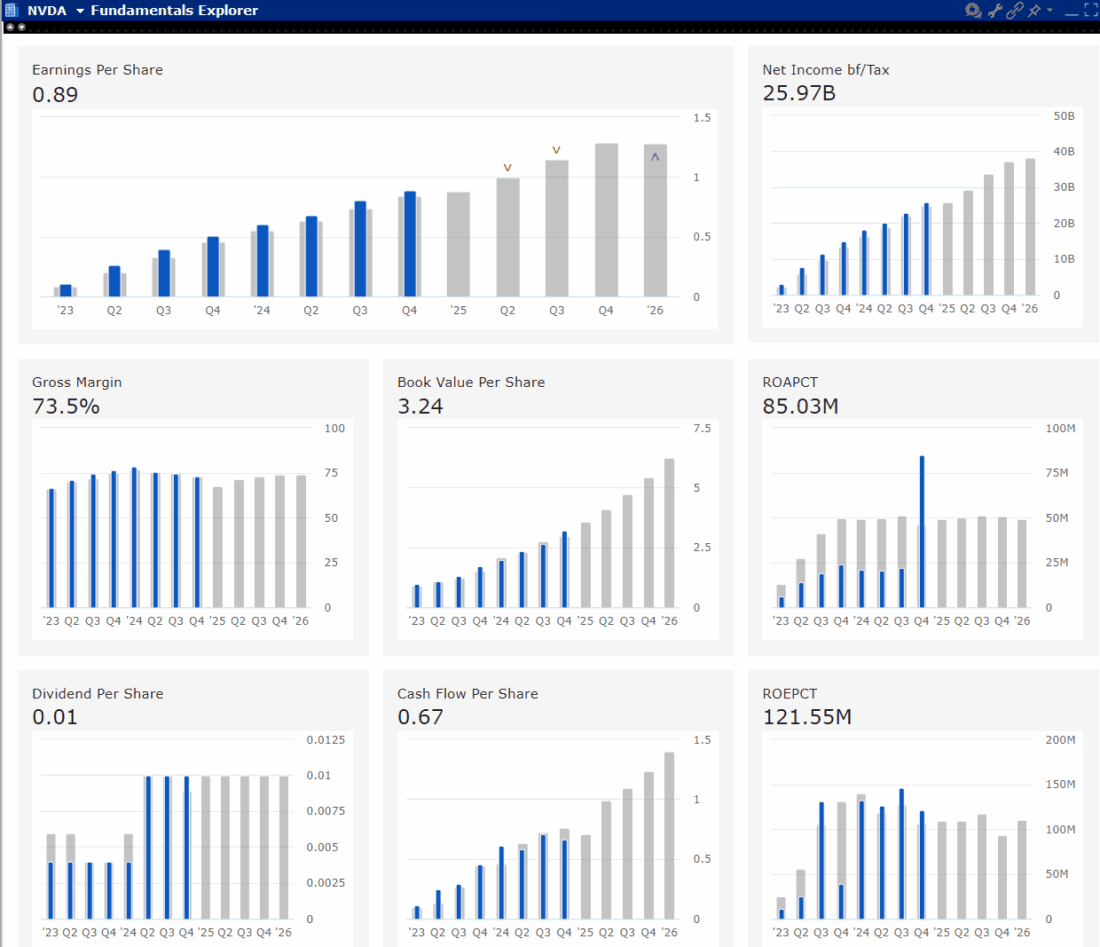
Source: Interactive Brokers
If there is a potential problem with NVDA, it is whether it will be a victim of its own success.Expectations are lofty – though not oppressively so – and it is difficult to expect a company with a $3.3 trillion market cap to continue to grow exponentially.If the company reports or expects only linear or modest growth, will investors find that sufficient?
Analysts are expecting $0.93 this quarter on revenues of $43 billion.That would imply a 52% jump in year-over-year quarterly earnings but “only” 4.5% more than the prior quarter.The EPS growth is expected to continue at roughly a 30% clip in the coming year.We will know soon enough if Jensen Huang can confirm that is likely to occur.
Traders seem reasonably confident that the company will not offer a negative surprise, though there is some caution priced into NVDA options. The IBKR Probability Lab for options expiring on Friday shows a generally symmetrical profile, though the peak outcome is in the $133-134 range, slightly below the current $136 price.
IBKR Probability Lab for NVDA Options Expiring May 30, 2025
(Click on image to enlarge)
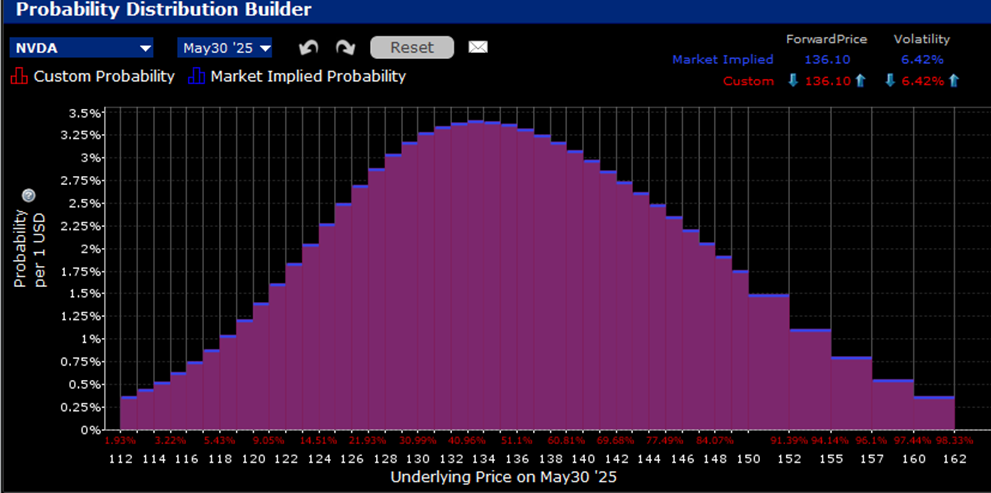
Source: Interactive Brokers
Skews for near-dated options are generally flat for strikes +/-10% around the current price, but we see a fairly steep skew for options below $120.Considering that the stock went somewhat vertical after breaking above $120 about two weeks ago, it seems reasonable for traders to hedge against a dip below that level.The chart also shows that at-money options imply a daily volatility of 7% between now and Friday.That is reasonably commensurate with the recent average of post-earnings moves for NVDA (7.2%), though there is quite a bit of dispersion among them (-8.48%, +0.53%, -6.38%, +9.32%, +16.40%, -2.46%)
Skews for NVDA Options Expiring May 30 (top), June 6th (middle), June 20th, 2025 (bottom)
(Click on image to enlarge)
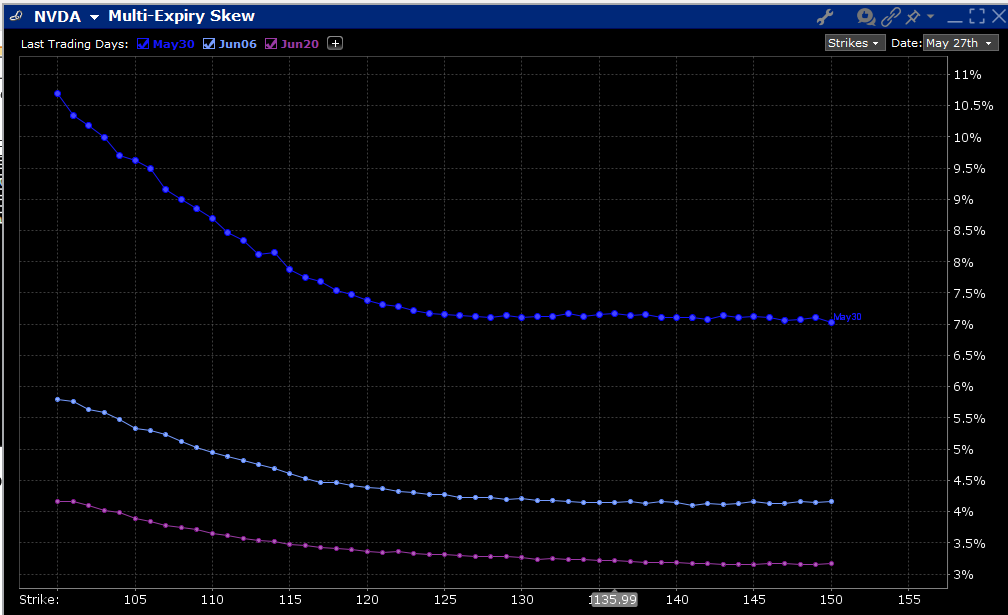
Source: Interactive Brokers
NVDA 6-Months, Daily Candles
(Click on image to enlarge)
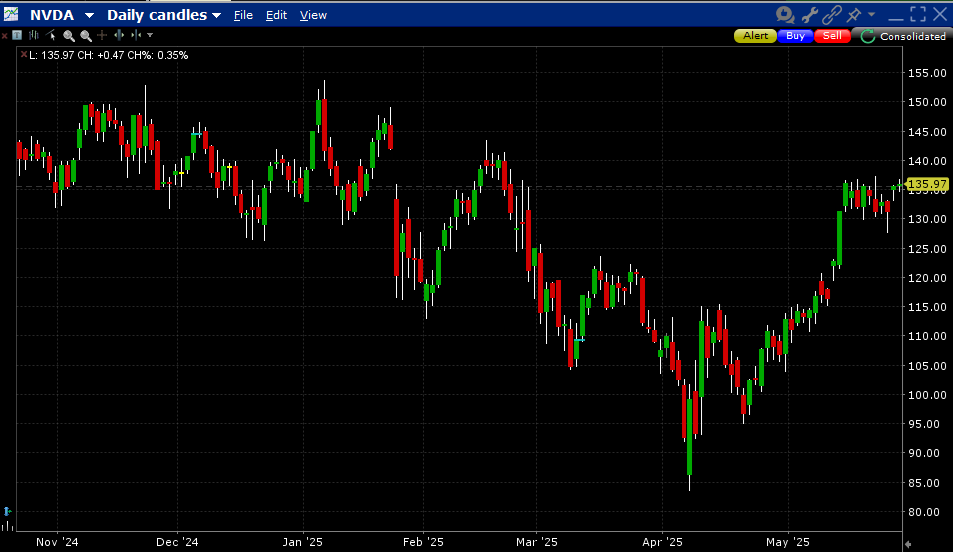
Source: Interactive Brokers
Bottom line: options market expectations appear reasonable for such a widely followed stock.The rest is up to the company and its management.
More By This Author:
Welcome Back
So Much For A Quite Pre-Holiday
It’s All About Bonds For Now


Comments
Log in or sign up to join the conversation.