

Image source: Pixabay
Using the Sahm rule:
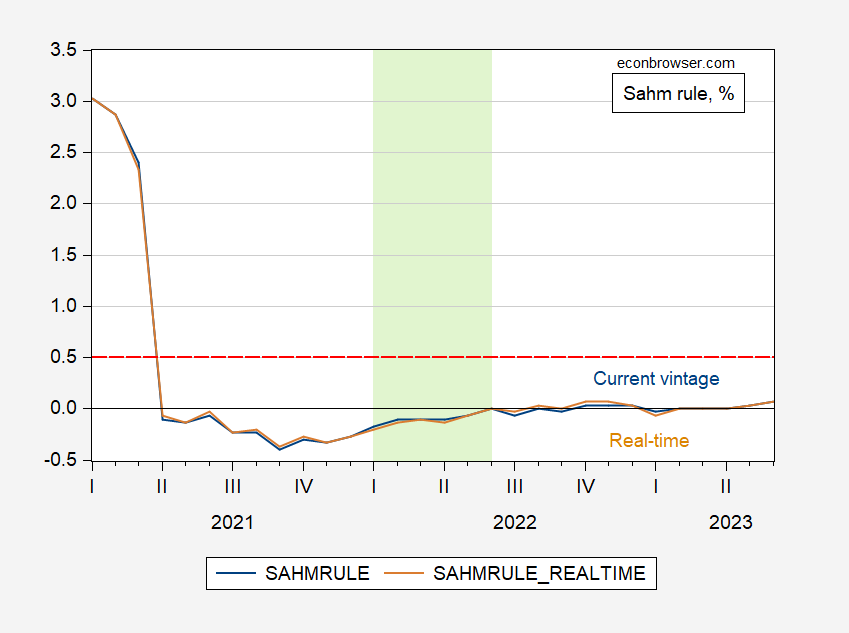
Figure 1: Sahm rule index using current vintage of data (blue), using real time data (tan), both in %. Threshold for recession is horizontal red dashed line at 0.5%. Light green shading denotes 2022H1. Source: FRED.
The Sahm rule is a pretty good indicator of when a NBER defined recession starts. Now, if you want to define a recession as when VMT goes down, gasoline consumption goes down, or the U.Michigan sentiment goes down, or when real wages go down, or when GDP in the current vintage is negative for two consecutive quarters, or the output gap i is negative, or when GDI is negative for two consecutive quarters, then you might find a recession in 2022H1. Just understand that it might not be a recession as other people define it.
By the way, here’s a picture of GDP, GDI, GDO, and GDP+. GDO is down, but GDP+ is up over 2022H1…
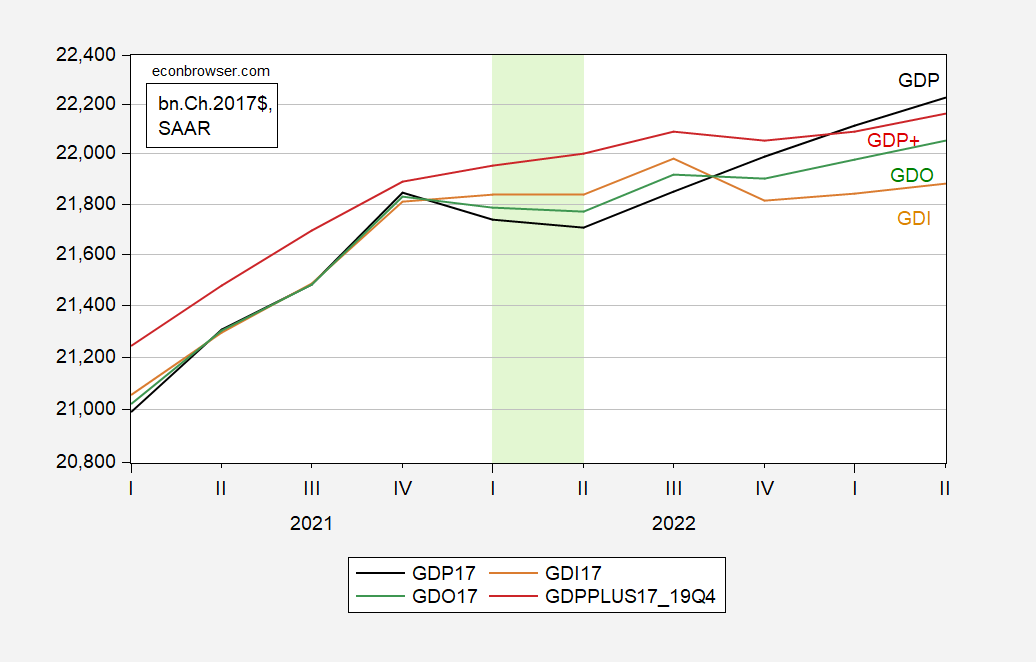
Figure 2: GDP (black), GDI (tan), GDO (green), GDP+ indexed to 2019Q4 (red), all in bn.Ch.2017$ SAAR. Light green shading denotes 2022H1. Source: BEA, Philadelphia Fed, and author’s calculations.
More By This Author:
Debt Projections Pre- And Post- Tax Cuts And Jobs Act (Of 2017)Under What Administrations Does the Debt-to-GDP Ratio Start Rising?
One Of The Three Is Not Like The Others: The Partisan Divide And Economic Sentiment


Comments
Log in or sign up to join the conversation.