

Image Source: Unsplash
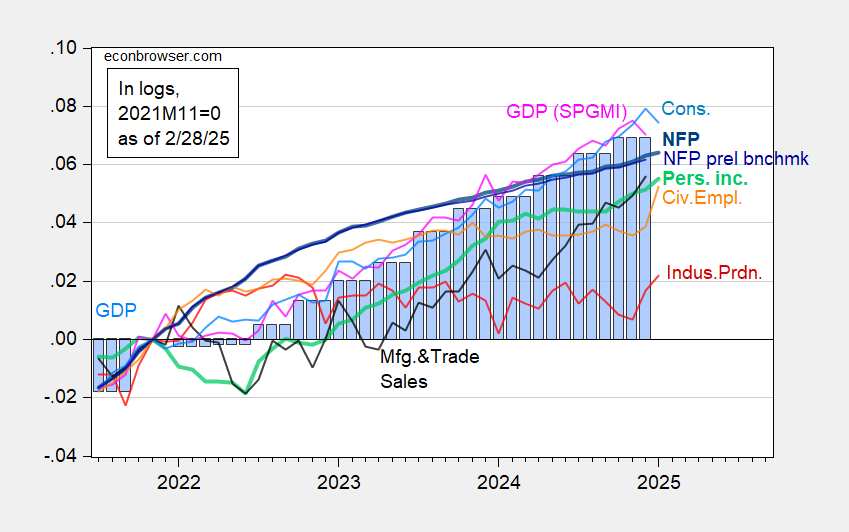
NBER Business Cycle Dating Committee key indicators. Consumption (preliminary) fell markedly.
(Click on image to enlarge)
Figure 1: Nonfarm Payroll incl benchmark revision employment from CES (bold blue), implied NFP from preliminary benchmark through December (blue), civilian employment as reported (orange), industrial production (red), personal income excluding current transfers in Ch.2017$ (bold light green), manufacturing and trade sales in Ch.2017$ (black), consumption in Ch.2017$ (light blue), and monthly GDP in Ch.2017$ (pink), GDP (blue bars), all log normalized to 2021M11=0. Source: BLS via FRED, Federal Reserve, BEA 2024Q4 advance release, S&P Global Market Insights (nee Macroeconomic Advisers, IHS Markit) (2/3/2025 release), and author’s calculations.
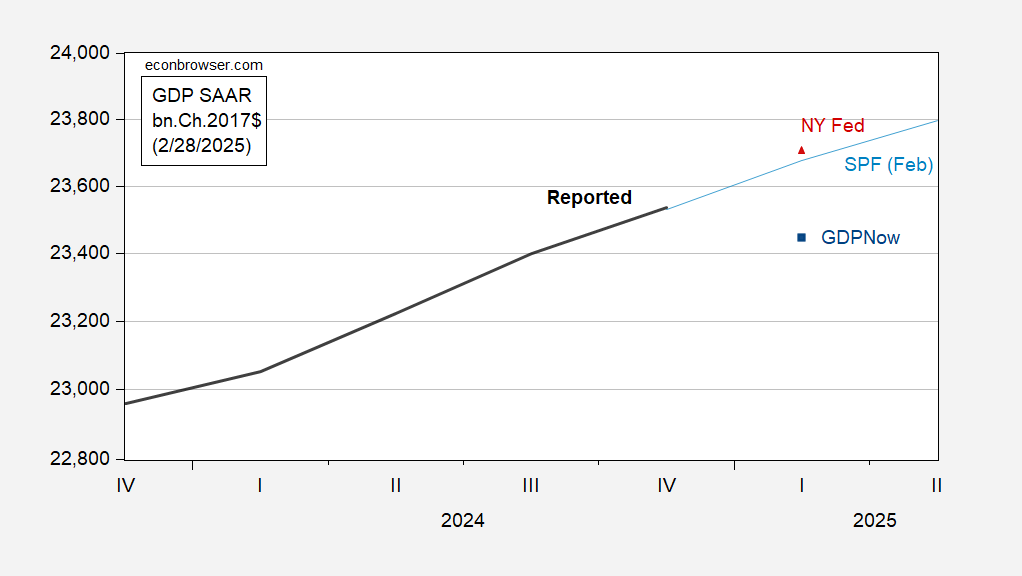
GDPNow dropped precipitously, to -1.4% q/q annualized.
(Click on image to enlarge)
Figure 2: GDP (bold black), Survey of Professional Forecasters February survey (teal), GDPNow of 2/28 (blue square), NY Fed nowcast of 2/28 (red triangle). Source: BEA, Philadelphia Fed, Atlanta Fed, NY Fed, and author’s calculations.
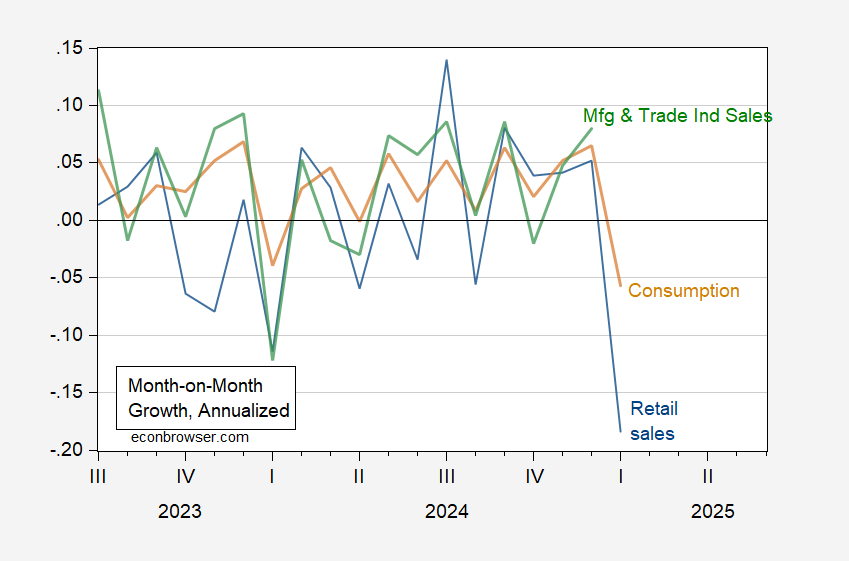
Off a cliff refers to this picture:
(Click on image to enlarge)
Figure 3: Retail sales deflated by chained CPI (blue), real consumption (tan), real manufacturing and trade industries sales (green), all month-on-month growth rates annualized (using log differences). Source: BEA, Census, St. Louis Fed via FRED, and author’s calculations.
More By This Author:
Reinversion ContinuesRecession Outlook Darkening
Egg Prices Keep On Rising


Comments
Log in or sign up to join the conversation.