
Not All Strategies Are Created Equal: A Look At The S&P MARC 5% (ER) Index Versus Other Multi-Asset Strategies
In this blog, we compare the S&P MARC 5% Excess Return (ER) Index with a peer group of 16 multi-asset 5% volatility-controlled excess return strategy indices currently in the market.[1] Overall, we observed that the diversification and weighting strategy of the S&P MARC 5% (ER) Index provided potential for upside while avoiding some of the broader market drawdowns and selloffs.
As part of the analysis, we made several different comparisons. First, we looked at the annualized returns over different periods across two different categories. Second, we compared relative performance across three different categories. After that, we looked at annualized returns over different periods by grouping the strategies into three performance groups over the respective periods. Finally, we examined these groups on a calendar year basis.
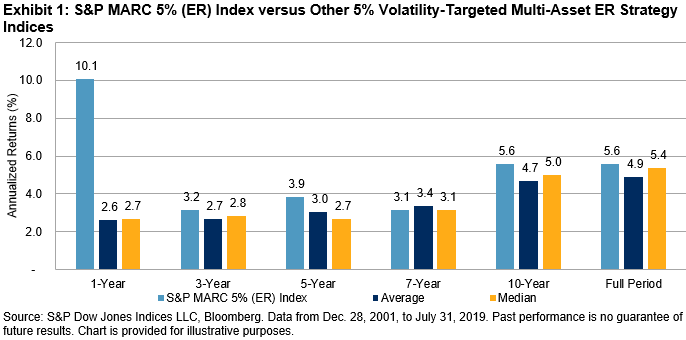
Comparison 1: Looking at the annualized returns over different periods, we used two different metrics.[2]
- The simple average return of all the strategies; and,
- The median return of all the strategies.
The S&P MARC 5% (ER) Index consistently outperformed the average and median of all the strategies over all timeframes with the exception of the seven-year period (see Exhibit 1). In the latter, the index was on par with the median and only slightly below the average performance.
Comparison 2: During the one-year period, we could see that much of the outperformance of the S&P MARC 5% (ER) Index was because it did not suffer from the market selloffs that other strategies experienced in October and December of 2018 (see Exhibit 2). The strategy ended the year positive, despite the challenging fourth quarter. From January 2019 to July 2019, the index experienced strong, sustained outperformance due to the asset diversification within the strategy. Each of the asset classes within the index saw 4%-18% growth between Dec. 31, 2018, and July 31, 2019.

Comparison 3: We looked at the relative performance of the S&P MARC 5% (ER) Index compared with other strategies, including the average returns of the top five, bottom five, and middle six strategies over a given period (see Exhibit 3). Similar to what we saw in Comparison 1, with the exception of the seven-year period, the S&P MARC 5% (ER) Index outperformed the middle six strategies across all periods. In addition, the index outperformed the bottom five strategies across all periods.

Comparison 4: We looked at how the performances stacked up on a calendar year basis. While it was not always the top-performing strategy, the S&P MARC 5% (ER) Index provided relatively consistent outperformance over the bottom five strategies in any given year, and typically performed in line with the average and median of each universe (see Exhibit 4).

[1] The data is aggregated and anonymized to avoid focusing on any specific index strategy. We have also standardized the holiday convention to match the S&P MARC 5% (ER) Index.
[2] The number of strategies in a given period may vary depending on the availability of history; these groupings do not include the S&P MARC 5% (ER) Index.
Copyright © 2018 S&P Dow Jones Indices LLC, a division of S&P Global. All rights reserved. This material is reproduced with the prior written consent of S&P DJI. For more information ...
more

