
Nonfarm employment:
In line with expectations.
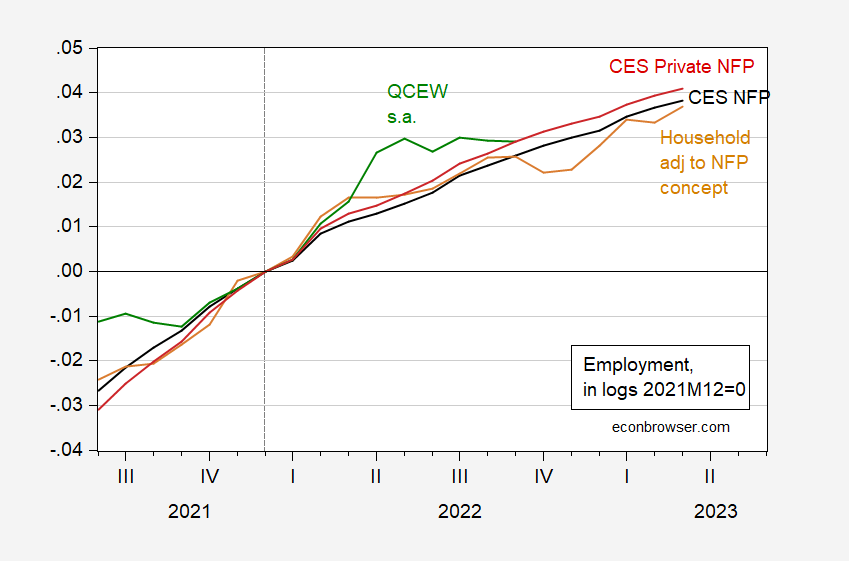
Figure 1: Nonfarm payroll employment (black), civilian employment adjusted to nonfarm payroll concept (tan), Quarterly Census of Employment and Wages total employment (green), and private nonfarm payroll employment (red), all in logs 2021M12=0. Source: BLS via FRED, BLS, BLS, and author’s calculations.
Note that the change in private NFP undershot expectations slightly, as well as that predicted by ADP private NFP.
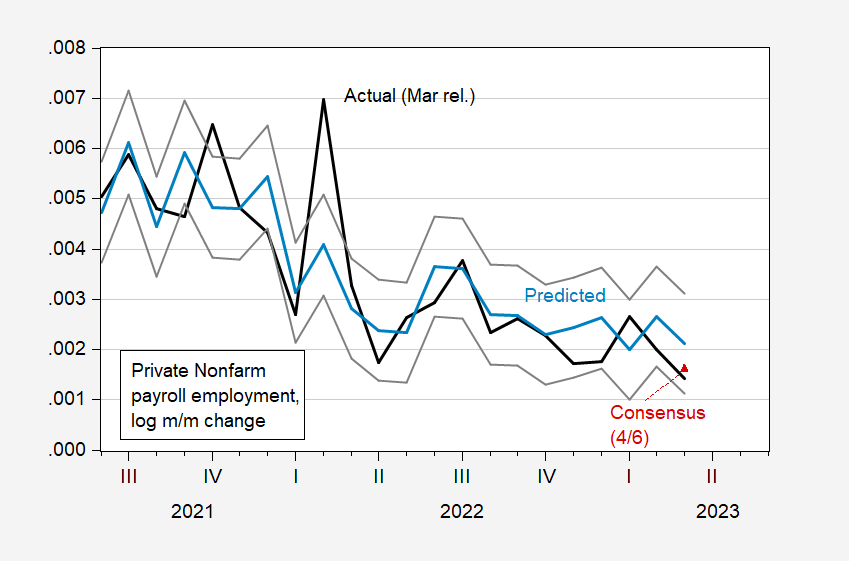
Figure 2: BLS nonfarm payroll employment series (black), and predicted (light blue), +/- 1 std error (gray lines), and Bloomberg consensus of 4/6, all s.a. Source: BLS (February, March releases), ADP via FRED, Bloomberg and author’s calculations.
More By This Author:
Weekly Macro Indicators Through End-MarchPrivate NFP Growth Predicted Using ADP Data
Coincident Index, Monthly GDP, And GDP+


Comments
Log in or sign up to join the conversation.