
In addition to updated reports on new home sales and prices, and existing home prices this morning, there’s some very important news on mortgage rates.
Namely, at 7.51%, mortgage rates are the highest they have been since December 2000. Here’s what they looked like through the end of last week:
(Click on image to enlarge)

As I wrote last week, this has caused a seizing up of the existing home market, with sales down 40% from their peak over a year ago.
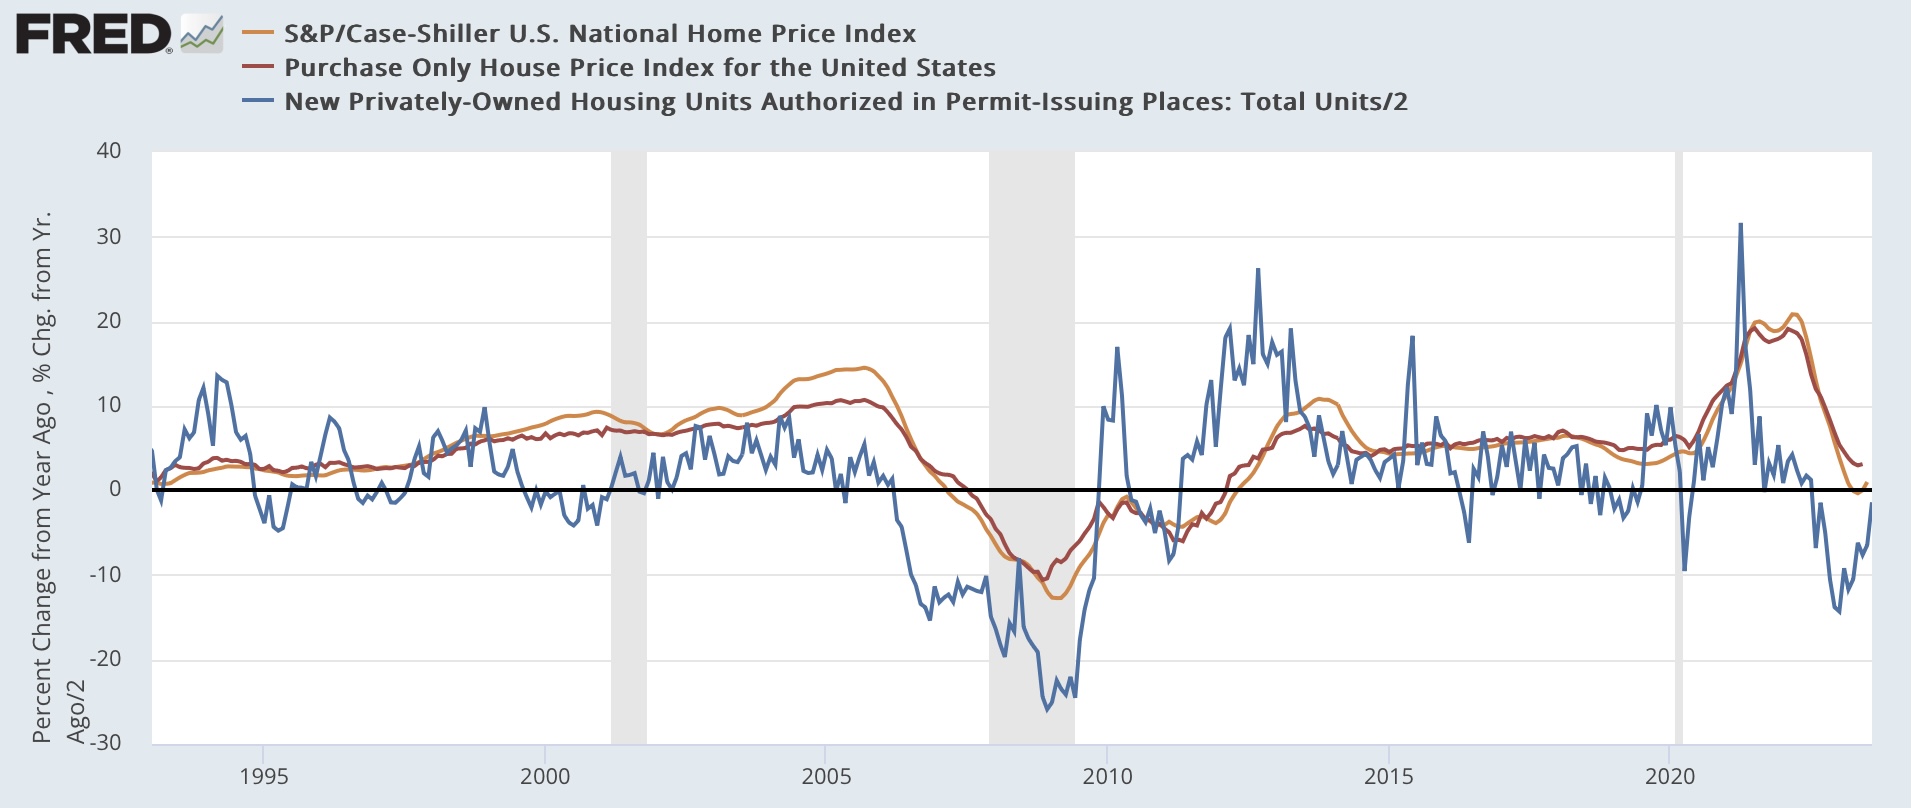
This is also going to worsen the new home market, which has held up better until now due to builders cutting prices. As per usual, interest rates lead sales, represented by housing permits in the YoY graph below:
(Click on image to enlarge)

Permits were already down a year ago, and despite their recent rebound it is likely they will decline further from those levels.
Further, sales lead prices. For existing homes, both the FHFA and Case Shiller reported this morning through July, with both showing monthly increases of 0.8% and 0.6% respectively. The FHFA index is up 4.6% YoY, and the Case Shiller national index is up 1.0%:
(Click on image to enlarge)

Meanwhile, new home sales declined by -64,000 annualized to 675,000, the lowest level since March. This is a very noisy and heavily revised series, but I suspect we are seeing the impact of the recent renewed increase in mortgage rates in this data:
(Click on image to enlarge)

The median price declined slightly to $430,300, and is now almost 15% below its peak from last October:
(Click on image to enlarge)

Here is the comparison of sales and median prices YoY for new homes, showing as per usual that sales lead prices there as well. The first graph is quarterly for the past 20 years to cut down on noise:
(Click on image to enlarge)
(Click on image to enlarge)
The second is monthly for the past 5 years:
(Click on image to enlarge)

Finally, because house prices lead Owners Equivalent Rent in the CPI by roughly 1 year or more, here is the YoY update of that comparison, using the median price index for new homes:
(Click on image to enlarge)

We can expect further disinflationary pressure on OER in the coming months, gradually lessening the shelter’s upward pull on both headline and core inflation.
More By This Author:
Sales Near 25 Year Lows, Huge Divergence Between New And Existing Home Sales ContinuesThe Big Picture Of The Housing Market, And Its Almost Complete Bifurcation
With Sales Near 25 Year Lows, The Huge Divergence Between The Existing And New Home Markets Continues


Comments
Log in or sign up to join the conversation.