
Netflix, A Meme-Stock Original
I’ve been bearish on Netflix (NFLX) for many years, not because the firm provides a poor service, but because it cannot monetize content as well or sustain investment in content for as long as its competitors. Though the stock has only become more overvalued, my bearish thesis is proving truer by the day.
With its huge subscriber miss in 1Q21 and weak guidance for subscriber growth, the weaknesses in Netflix’s business model are undeniable. As a growing number of competitors take market share at a rapid rate, it’s clear that Netflix cannot generate anywhere close to the profits implied by the current stock price. Netflix is back in the Danger Zone.
The New Normal: Market Share Losses
Netflix reported just under 4 million new subscribers in 1Q21, well below its previous guidance of 6 million and consensus expectations of 6.3 million. Management guided for just one million subscriber additions in 2Q21, which puts Netflix on the lowest subscriber addition trajectory since 2013, or when Netflix began producing original content.
Netflix can claim, as they did in their 1Q21 earnings press release, that competition didn’t play a large role in the subscriber miss, but market share data for the streaming industry indicates otherwise. According to a report by Ampere Analysis, a media and content analytics firm, Netflix’s share of the U.S. streaming market fell from 29% in 2019 to 20% in 2020. Figure 1 shows Netflix lost a lot of market share and gained a lot of competitors in 2020.
Figure 1: More Competitors and Less Market Share For Netflix
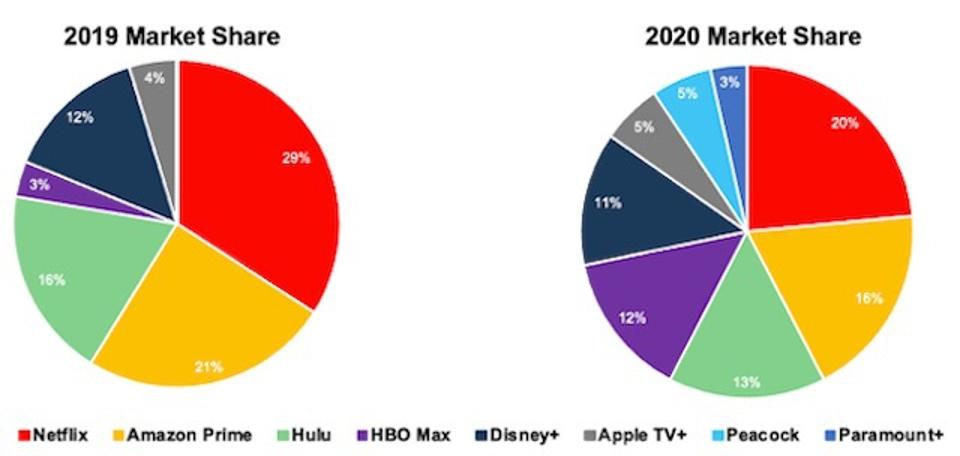
Market Share of Streaming Platforms 2019-2020 NEW CONSTRUCTS, LLC AND AMPERE ANALYSIS
I expect Netflix will continue to lose market share as more competitors enter the market and deep-pocketed peers like Disney and Amazon continue to invest heavily in streaming. For reference, Disney+ expects to add ~35-40 million subscribers a year through 2024, while, at its 2021 trajectory (Netflix expects to add just 5 million subscribers in the first half of 2021), Netflix will only add ~10 million subscribers per year through 2024.
The streaming market is now home to at least 14 streaming services with 10+ million subscribers (see Figure 2). Many of these competitors (i.e. Disney, Amazon [AMZN], YouTube [GOOGL], Apple [AAPL], Paramount [VIAC] and Warner Bros.[T]) have profitable businesses that can subsidize lower-cost streaming offerings and permanently reduce Netflix’s subscriber growth potential.
Figure 2: Lots of Competitors in Online Streaming Because Barriers To Entry Are Low
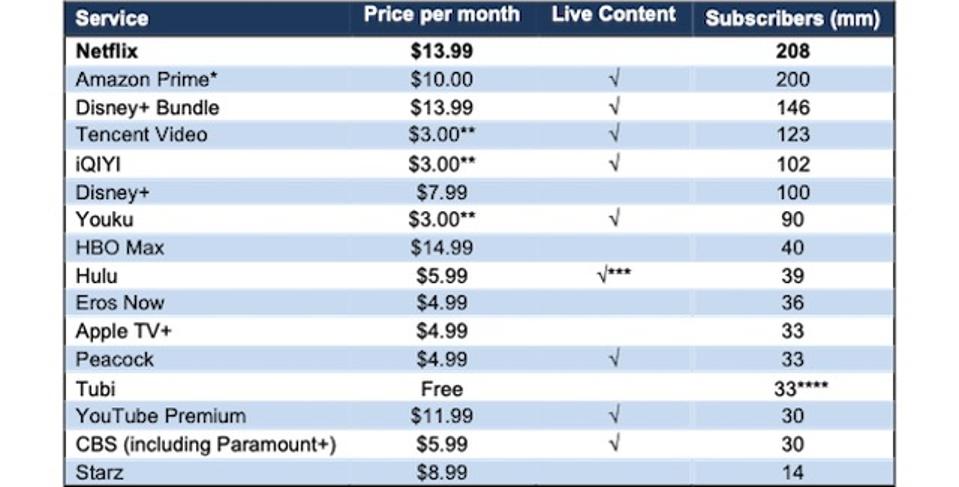
Streaming Competitors In The Market NEW CONSTRUCTS, LLC
*Represents Amazon Prime members, all of which can use Amazon Prime. Amazon hasn’t officially disclosed Prime Video users.
**Pricing based in Yuan, converted to Dollars
*** Requires subscription to Hulu + Live TV
***Monthly Active Users (MAUs). As a free service, Tubi reports MAUs instead of numbers of subscribers.
Top Line Pressure: Hard to Sell Price Hikes With So Many Low Cost Alternatives
To date, I underestimated Netflix’s ability to raise prices while maintaining subscription growth, because I expected competitors to enter the streaming market sooner. But, now that the competition is here, my thesis is playing out as expected.
As a result, consumers have a growing list of lower-cost alternatives to Netflix and may not be as willing to accept price hikes going forward. Per Figure 3, Netflix already charges more than nearly every other major streaming service. For reference, I use Netflix’s “Standard” plan, as it allows streaming across multiple devices, as do each of its competitors at the monthly rates in Figure 3.
Figure 3: Monthly Price for Streaming Services in the U.S.
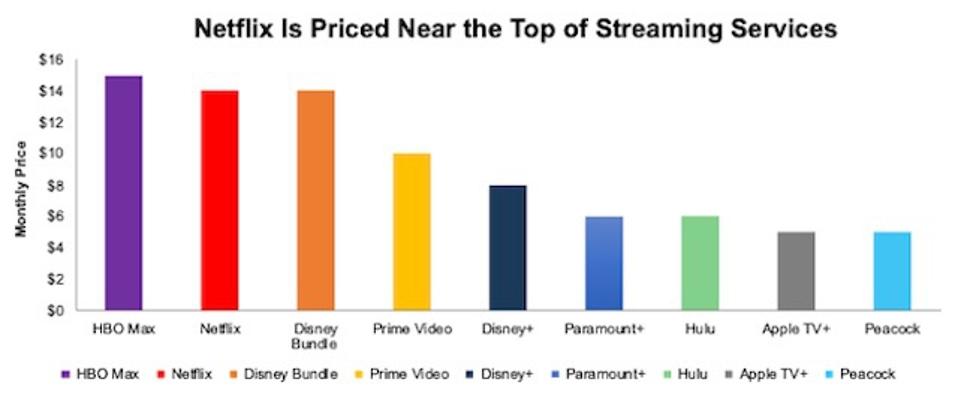
Prices Of Streaming Platforms NEW CONSTRUCTS, LLC
Competition Hurts the Bottom line Too…
Increased competition hasn’t only hurt subscriber growth, market share, and pricing power, it also raises the costs for the company to produce, license, and market its content.
In recent years, Netflix has had to spend more to secure content creators, such as the $150 million deal for Greys Anatomy creator Shonda Rhimes in 2017 and the $300 million deal for Game of Thrones creators David Benioff and D.B. Weiss in 2019, to long-term contracts.
Netflix’s is paying more than ever to acquire subscribers. Marketing costs and streaming content spending has risen from $308/new subscriber in 2012 to $565/new subscriber over the trailing-twelve months (TTM).
For a user paying $14/month in the US, it takes over three years for Netflix to break even. It takes nearly five years to break even on international users, where Netflix is seeing the most subscriber growth.
Despite a 3+ year break-even period for new customers, Netflix often cancels shows after three seasons. Such a strategy keeps content fresh, but it is very expensive and also risks alienating subscribers that signed up for a particular show before Netflix can break even on them.
Competition Creates a Catch 22: Growth or Profits, but Not Both
Netflix’s free cash flow was positive in 2020 because the firm cut content spending. But, not growing content spending in 2020 resulted in subscriber growth cratering – per Figure 4.
Figure 4 also shows a clear trend in declining returns on content spending over the last several years. Despite growing content spending, subscriber growth was decelerating.
So…Netflix plans to spend $17 billion on new content in 2021….but will it work? The data suggests “no” and that throwing billions of dollars at content will not be enough to fend off its competition.
Here is where Netflix narrative breaks down: the content spending cuts needed to be profitable prevent Netflix from achieving the scale (i.e. number of subscribers) needed to justify its lofty valuation.
Figure 4: Declining Returns on Content Spend
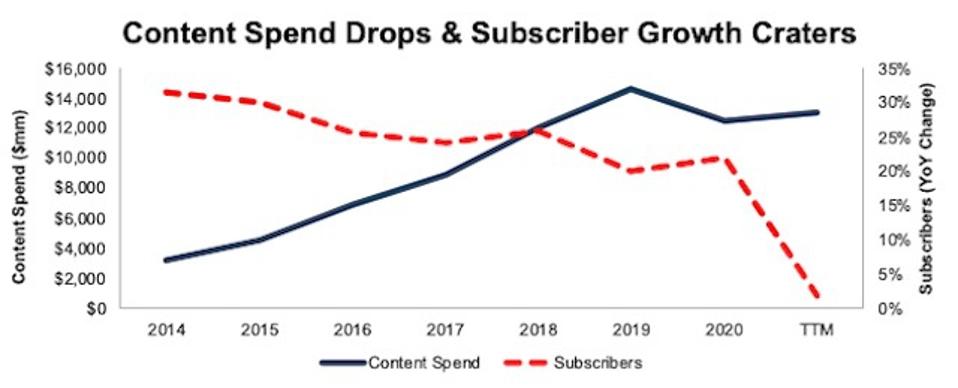
NFLX Content Spend Vs Subscriber Growth NEW CONSTRUCTS, LLC
Original Content Not as Popular as Licensed Content
Spending lots of money does not guarantee high-quality content. Here’s The Verge’s take on Netflix’s original content strategy: “the scattershot tactics of Netflix’s hundreds of original shows and movies that flare up into the spotlight for a few days or weeks and are then forgotten.”
So far, spending billions on original content may win some awards, but subscribers still like licensed content more. In 2020, Netflix’s licensed content assets ($13.7 billion) made up 54% of the $25.4 billion in total content assets probably because Netflix subscribers like it better than the firm’s original content. For example:
- In October 2020, of the 52 billion minutes of streamed series/movies tracked by Nielsen over the prior six weeks, just 3% of viewed minutes was spent on Netflix-produced shows
- Netflix’s three most streamed series in 2020 were licensed
- For the week of 3/15/21 through 3/21/21[1] (the most recent week available), of the top 10 shows on Netflix, licensed content garnered 72% of minutes viewed versus just 28% for original content.
And Licensed Content is Too Expensive
Netflix’s shift to original content was a bet that it could wean viewers off licensed content and forgo the costly (and ongoing) license fees. Original content, in general, can be cheaper than licensed content, but that advantage only translates to profits if it is as least as popular, which it is not.
Consequently, Netflix must continue to invest a significant amount of money in its licensed content library, such as the $500 million for Seinfeld and the more recent deal with Sony Pictures, rumored to cost $1 billion.
The Real Problem: Limited Ability to Monetize Content
Netflix has one revenue stream, subscriber fees, while Disney (DIS) monetizes content across its theme parks, merchandise, cruises, and more. Additionally, competitors such as AT&T (T) and Comcast/NBC Universal (CMCSA) generate cash flows from other businesses that can help fund streaming platforms.
As a result, Netflix loses money while competitors make money. Figure 5 compares Netflix’s cash burn to Disney’s cash generation. Since calendar 2Q19, Netflix has burned $1 billion in free cash flow while Disney generated $4.7 billion in FCF. Netflix burned $11.7 billion in FCF over the past five years.
Figure 5: Netflix vs. Disney: Cumulative Free Cash Flow Since Calendar 2Q19
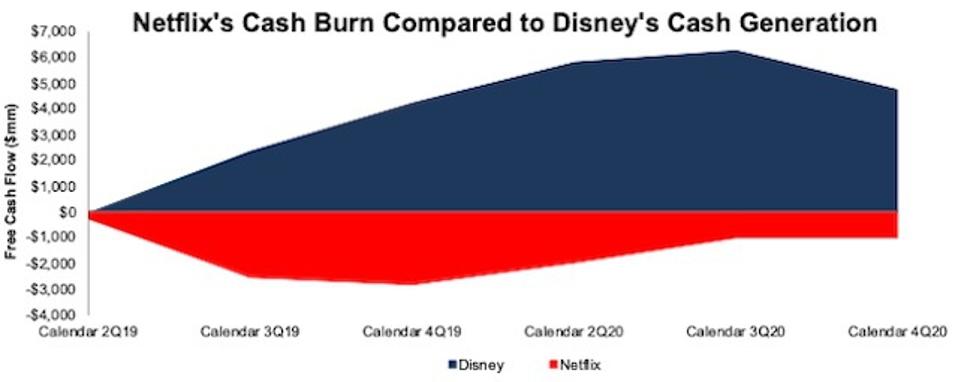
NFLX vs DIS FCF Generation NEW CONSTRUCTS, LLC
The stark contrast begs the question – how long can Netflix keep up? I don’t think Netflix’s money-losing mono-channel streaming business has the staying power to compete with Disney’s (and all the other video content producers’) original content spending – at least not at the level to grow subscribers and revenue at the rates implied by its valuation.
No Live Content? Another Problem
Netflix, as of mid-2020, has no plans to grow subscribers through the addition of live sports. CEO Reed Hastings noted, “But right now, Ted’s [co-CEO and chief content officer Ted Sarandos] got every billion dollar earmarked for bigger movies, bigger series, animation of course… At least for the next couple of years, every content dollar is spoken for.”
Meanwhile, Disney, Amazon, CBS, NBC, and Fox (each of which as their own streaming platform) are securing rights to more and more live content, especially the NFL and NHL, which gives them a very popular offering[2] that Netflix cannot match.
Netflix’s Valuation Requires 2x Combined Revenue of Fox and ViacomCBS
I use my reverse discounted cash flow (DCF) model and find that the expectations for Netflix’s future cash flows look overly optimistic given the competitive challenges above and guidance for slowing user growth. To justify Netflix’s current stock price of ~$505/share, the company must:
- maintain its record-high 2020 NOPAT margin of 16% (vs. five-year average of 9% and three-year average of 12%) and
- grow revenue 14% compounded annually for the next decade, which assumes revenue growth at consensus estimates in 2021-2023 and 13% each year thereafter
In this scenario, Netflix’s implied revenue in 2030 of $89.4 billion is more than 3.5x its 2020 revenue, 2x the combined TTM revenue of Fox Corp (FOXA) and ViacomCBS and 47% greater than Disney’s TTM revenue. See the math behind this reverse DCF scenario.
Netflix’s NOPAT in this scenario is over $14 billion in 2030, or over 3.5x its 2020 NOPAT. Figure 6 compares Netflix’s implied NOPAT in 2030 with the 2019 NOPAT[3] of other content production firms. As shown in Figure 6, to justify its current price, Netflix’s profits must grow to 132% of Disney’s 2019 NOPAT.
Figure 6: Netflix’s 2019 NOPAT and Implied 2030 NOPAT vs. Incumbents

Netflix Is Worth Just $231/share If Profit Margins Can’t Be Sustained
Below, I use my reverse DCF model to show the implied value of NFLX under a more conservative scenario that reflects a more realistic assessment of the mounting competitive pressures on Netflix. Specifically, I assume:
- Netflix’s NOPAT margin falls to 12.1%, equal to its 3-year average
- Netflix grows revenue by 10% compounded annually for the next decade, which assumes revenue growth at consensus estimates in 2021-2023 and 7% each year thereafter
In this scenario, Netflix’s NOPAT in 2030 is over nearly $8 billion (nearly 2x 2020 NOPAT) and the stock is worth just $231/share today – a 54% downside to the current stock price. See the math behind this reverse DCF scenario.
Both Scenarios Might be Optimistic
Each of the above scenarios assumes Netflix’s YoY change in invested capital is 10% of revenue (same as 2020) in each year of my DCF model. For context, Netflix’s invested capital has grown 40% compounded annually since 2013 and change in invested capital has averaged 24% of revenue each year since 2013.
Figure 7 shows just how capital intensive Netflix’s business has been since 2013. Not only is invested capital larger than revenue, but change in invested capital has been equal to or greater than 10% of revenue each year since 2013.
Clearly, assuming the YoY change in invested capital of revenue stays at just 10% is very conservative. I think spending will need to be much higher to achieve the growth that I forecast. Nevertheless, I use this lower assumption to underscore the risk in this stock’s valuation.
Figure 7: Netflix Revenue, Invested Capital, and Change in Invested Capital as % of Revenue: 2013-2020
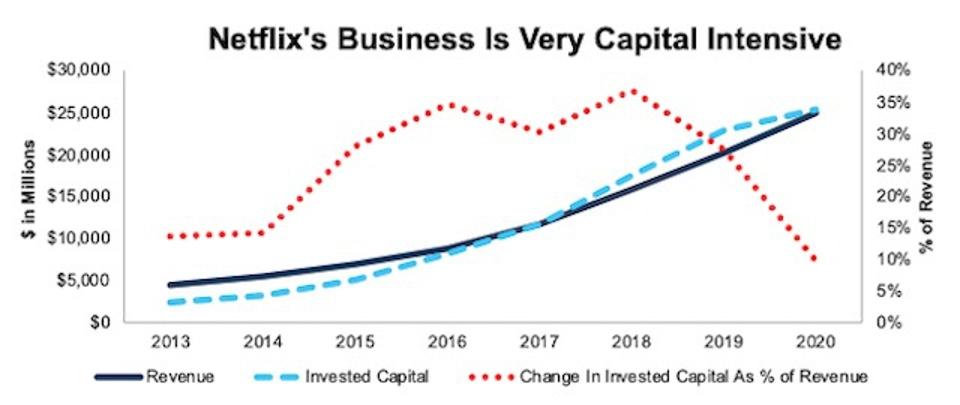
NFLX Invested Capital And Revenue NEW CONSTRUCTS, LLC
No Acquisition Bailout on the Horizon
For a long time, many investors thought Netflix would be bought by a larger competitor. However, with all the major networks/studios launching their own streaming services, who’s left to consider acquiring the company? Netflix has been a victim of its own high valuation. Companies who considered building vs. buying a streaming service realized they could build their own platforms for far less than the cost of acquiring Netflix. They chose to compete with Netflix rather than join forces because they believe they can beat Netflix.
Catalyst: Another Subscriber Miss – Lookout Below
Netflix currently trades down ~8% since reporting its 1Q21 results. As noted above, Netflix will likely continue to struggle to meet subscriber growth expectations no matter how much it spends on new content. With an already low bar set for 2Q21 subscriber growth, another miss could send shares much lower.
What Noise Traders Miss With NFLX
These days, fewer investors pay attention to fundamentals and the red flags buried in financial filings. Instead, due to the proliferation of noise traders, the focus tends toward technical trading tends while high-quality fundamental research is overlooked. Here’s a quick summary for noise traders when analyzing Netflix:
- Netflix lack’s a competitive moat, outside of being able to burn billions of dollars
- Netflix’s limited ability to monetize content beyond streaming
- Stock valuation implies Netflix generates more profits than Disney and ViacomCBS
Executive Compensation Forgoes Performance Based Awards
As the compensation committee notes, “we do not use performance-based bonuses as we believe that they tend to incentivize specific, typically short-term focused behavior rather than encourage long-term shareholder value creation.”
I agree that performance-based bonuses incentivize specific behavior, and often companies use poor performance metrics that award executives while they destroy shareholder value. However, compensation plans that use quality performance metrics, such as improving ROIC, which is directly correlated with creating shareholder value, properly align shareholders’ interest with executives’ interests.
Insiders Are Selling and Short Interest Is Notable
Over the past three months, insiders have purchased 108 thousand shares and sold 454 thousand shares for a net effect of ~347 thousand shares sold. These sales represent less than 1% of shares outstanding.
There are currently ~9 million shares sold short, which equates to ~2% of Netflix’s float and just under two days to cover. The percentage of float shorted has increased from ~1.9% at the end of 2020. With low short interest, don’t expect Netflix to go on a meme-stock-driven short-squeeze rally with the likes of GameStop (GME) or AMC Entertainment (AMC).
Critical Details Found in Financial Filings by My FIrm’s Robo-Analyst Technology
Below are specifics on the adjustments I make based on Robo-Analyst findings in Netflix’s filings:
Income Statement: I made $1.8 billion of adjustments, with a net effect of removing $1.2 billion in non-operating expense (5% of revenue). You can see all the adjustments made to Netflix’s income statement here.
Balance Sheet: I made $10.2 billion of adjustments to calculate invested capital with a net decrease of $7.7 billion. One of the most notable adjustments was $713 million in asset write-downs. This adjustment represented 2% of reported net assets. You can see all the adjustments made to Netflix’s balance sheet here.
Valuation: I made $33.2 billion of adjustments with a net effect of decreasing shareholder value by $19.3 billion. Apart from $20.8 billion in total debt, the most notable adjustment to shareholder value was $7 billion in excess cash. This adjustment represents 2% of Netflix’s market cap. See all adjustments to Netflix’s valuation here.
Unattractive Funds That Hold NFLX
The following funds receive an unattractive rating and allocate significantly to Netflix.
- Touchstone Sands Capital Select Growth Fund (TSNAX) – 6.8% allocation
- Deutsche DWS Communications Fund (TISHX) – 5.7% allocation
- MassMutual Select Growth Opportunities Fund (MAGLX) – 5.4% allocation
- John Hancock Multifactor Media and Communications ETF (JHCS) – 5.0% allocation
- Invesco Dynamic Media ETF (PBS) – 5.0% allocation
[1] Based on Nielsen’s weekly releases of the most viewed streaming shows measured by minutes watched.
[2] In the final six weeks of the 2020 season, the average Monday Night Football game averaged nearly 13 million viewers, and Super Bowl LV drew ~92 million viewers.
[3] I use 2019 NOPAT in this analysis to analyze the pre-COVID-19 profitability of each firm, given the pandemic’s impact on the global economy in 2020.
Disclosure: David Trainer, Kyle Guske II, and Matt Shuler receive no compensation to write about any specific stock, style, or theme.


