
Betting Against Beta: New Insights

Image Source: Unsplash
The 2014 study by Andrea Frazzini and Lasse Pedersen, “Betting Against Beta,” established strong support for low-beta (as well as low-volatility) strategies. The authors found that for U.S. stocks, the betting against beta (BAB) factor (a portfolio that holds low-beta assets leveraged to a beta of 1 and shorts high-beta assets deleveraged to a beta of 1) realized a Sharpe ratio of 0.78 between 1926 and March 2012—about twice the value effect’s Sharpe ratio and 40 percent higher than momentum’s Sharpe ratio during the same period.
Frazzini and Pedersen also found that the BAB factor showed highly significant risk-adjusted returns after accounting for its realized exposure to the market beta, value, size, momentum, and liquidity factors. And BAB realized a significant positive return in each of the four 20-year subperiods between 1926 and 2012. What’s more, their analysis of 19 international equity markets revealed similar results. The authors further found that BAB returns have been consistent across countries, across time, within deciles sorted by size, and within deciles sorted by idiosyncratic risk, and have been consistently robust to a number of specifications.
As still more supporting evidence, Frazzini and Pedersen found that in each asset class they examined (stocks, U.S. Treasury bonds, credit markets, and futures markets for currencies and commodities), alphas and Sharpe ratios declined almost monotonically as beta increased. These consistent results suggest that coincidence or data mining are unlikely explanations.
Their findings led Frazzini and Pedersen to conclude that there is…
“broad evidence that the relative flatness of the security market line is not isolated to the U.S. stock market but that it is a pervasive global phenomenon. Hence, this pattern of required returns is likely driven by a common economic cause.”
Their groundbreaking paper remains one of the most frequently cited in finance.
The intuition behind the anomaly is that leverage-constrained investors, instead of applying leverage, obtain an expected return higher than the market’s expected return through overweighting high-beta stocks and underweighting low-beta stocks in their portfolios. Their actions lower future risk-adjusted returns on high-beta stocks and increase future risk-adjusted returns on low-beta stocks. (Deeper discussion is available here on risk/behavioral explanations).
Time-Varying Premium
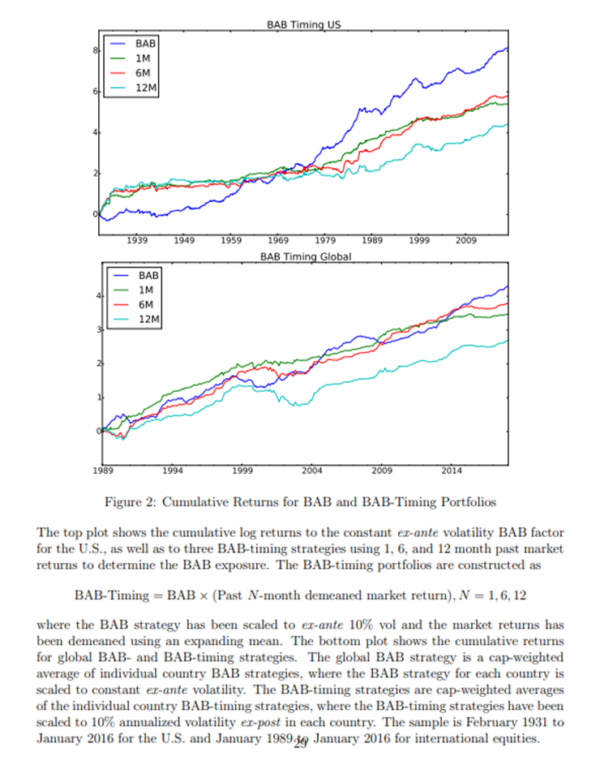
Esben Hedegaard of AQR Capital Management contributed to the literature on the low-beta anomaly with his June 2018 study, “Time-Varying Leverage Demand and Predictability of Betting-Against-Beta.” He demonstrated that the returns to BAB are time-varying and dependent on prior period returns. For the U.S. his dataset covered the period 1931 through January 2018. His international dataset, covering 23 countries, began in 1988 or later. The following is a summary of his key findings:
- High (low) past returns on the market forecast high (low) future returns on the BAB factor; realized BAB returns are higher (lower) following high (low) past market returns.
- Because expected returns move opposite to prices, high (low) market returns lead to contemporaneously low (high) returns on the BAB factor.
- The results held for both U.S. BAB returns and all 23 international country BAB returns, as well as for BAB factors formed from country indexes.
- The economic magnitude was large, with a coefficient of 0.41 on the past 12-month average BAB return. A 10 percent return over the past 12 months predicted an abnormal 4 percent annualized return on the BAB factor over the next month.
- The difference in BAB returns following high and low market returns was not explained by different exposures to the common factors of size, value, or momentum.
- A BAB timing strategy that took a position across all 24 countries (based on past 12-month returns) generated positive alpha to a two-factor (size and value) model with the market and BAB factors in all but two of them, and the alpha was significant in 12 of the 24 countries.
- Sorting countries based on their past market returns showed that future BAB returns were higher (lower) in countries for which past market returns were higher (lower) than the cross-country average market return.
The results are hypothetical results and are NOT an indicator of future results and do NOT represent returns that any investor actually attained. Indexes are unmanaged, do not reflect management or trading fees, and one cannot invest directly in an index.
Hedegaard also tested the predictability of BAB using country indexes. The BAB strategy went long the country indexes with a low beta relative to a global index and short the country indexes with a high beta relative to a global index. He found both that the BAB strategy generated positive returns in a region of 25 emerging market countries and that for each region the returns on the BAB strategy were predictable by past returns on a cap-weighted index of the countries in it.
Hedegaard concluded:
“These results show a strong pattern in the time-series and cross-country variation of expected returns. Low-beta stocks outperform high-beta stocks on average, on a risk-adjusted basis, but the outperformance is stronger when and where past market returns are high.”
His findings have important implications for investors; in particular, when past returns are high, the risks of owning high-beta stocks significantly increase. Mutual fund investors should be sure they understand their fund’s level of exposure to market beta after periods of strong performance.
New Insights
In their study “Betting Against Betting Against Beta” (BABAB), published in the January 2022 issue of the Journal of Financial Economics, Robert Novy-Marx and Mihail Velikov reexamined the performance of the betting against beta factor. They began by noting that the authors used unconventional procedures to construct their factor, which Jack Vogel also covered in his review of BAB here. Their main critique of the betting against beta paper was that its construction methodology results in a basically equal-weighting strategy instead of the conventional market-cap weighting (and thus ends up with large positions in very small-cap stocks with high transactions costs). Let’s address this issue.
In his own 2016 study “Understanding Defensive Equity,” which covered the period 1968 through 2015, Novy-Marx found that when ranking stocks by quintiles of either volatility or market beta, the highest-quintile stocks dramatically underperformed, while the performance of the other four quintiles was very similar and market-like. He also found that high-volatility and high-market-beta stocks tilt strongly to small stocks (specifically small-cap, unprofitable, and growth firms)—defensive strategies tilt strongly toward large-cap stocks (low-volatility stocks were 30 times as large as high-volatility stocks at the end of his sample, and the long/short portfolio had an SMB loading of -1.12). This finding conflicts with both the belief that BAB strategies should have high transactions costs and that they are concentrated in small stocks. I would add that transactions costs can be minimized through patient, algorithmic trading. AQR has published results showing that its live transactions costs have been well below those estimated in the literature. Thus, the estimates of the negative impact of trading costs shown by Novy-Marx and Velikov might be significantly overstated—or they are related to one specific implementation of BAB, not a general characteristic of low risk (defensive) investing in general.
Further, the evidence (as presented by Novy-Marx and Velikov themselves) demonstrates that the BAB strategy also worked for value-weighted returns (though with a smaller excess return). In fact, AQR data shows that over the full period from the 1920s until today, value weighting, rank weighting, and equal weighting have performed similarly, with value weighting outperforming until the 1960s, and the reverse holding in the last half of the sample—the new BABAB paper only looked at the second part of the sample. In addition, if the economic question is to understand the connection between risk and return, rank or equal weighting is perfectly appropriate. Market-cap weighting is the convention because of implementation concerns, not because of any economic theory.
As further support for the BAB strategy, in their 2007 paper “The Volatility Effect: Lower Risk without Lower Return,” David Blitz and Pim van Vliet found that low volatility worked globally for developed market large-cap stocks, with an annual spread between the lowest- and highest-volatility stocks of 5.9 percent from 1986 through 2006. The lowest risk decile had a Sharpe ratio of 0.72 compared to 0.40 for the market and 0.05 for the highest-volatility decile. Results also held for the U.S., European and Japanese markets. And in their 2012 study “The Volatility Effect in Emerging Markets,” David Blitz, Juan Pang, and Pim Van Vliet extended these results to emerging markets. Using data from 30 emerging market countries covering the period 1988 through 2010, they found an annual spread of 2.1 percent.
The other major criticisms by Novy-Marx and Velikov are that accounting for transaction costs significantly reduces BAB’s profitability and that its returns are explained by its tilts toward profitability and investment—“it does not have a significant net alpha relative to the Fama and French (2015) five-factor model.” Let’s address those findings.
First, while Novy-Marx and Velikov did find that market-cap weighting reduced the profitability of BAB, they also found that a value-weighted BAB earned economically and statistically significant positive excess returns—56 basis points per month (t-stat = 3.5), with a Sharpe ratio of 0.49 (higher than the Sharpe ratio of the market beta factor). And as discussed above, Novy-Marx and Velikov may have significantly overestimated the impact of trading costs. Second, the BAB paper was published in 2014, before Fama-French added the investment and profitability factors to their model. Thus, while their finding does have implications for investment strategies, it is not a critique of the BAB paper—Frazzini and Pedersen could not have controlled for factors not yet in the literature. With that said, they did find that BAB earned much of its returns by tilting strongly to profitability (0.45 loading on RMW [robust minus weak], t-stat = 6.6) and investment (loading 0.50 on CMA [conservative minus aggressive], t-stat = 4.9). However, the strategy’s alpha relative to the Fama-French five-factor model was still economically significant, if not statistically significant at conventional levels, with the excess return of 24 basis points per month (t-stat = 1.6). Note that because the newer RMW and CMA factors are only available beginning in 1963, that shortens the sample period, negatively impacting t-stats. It would also have been interesting if Novy-Marx and Velikov had tested to see if CMA and RMW worked because they load on BAB (which has strong theoretical support).
Investor Takeaways
Novy-Marx and Velikov raised some important issues in their work. First, they alerted investors to question the use of unconventional construction methodologies, as they may be the result of data mining exercises (torturing the data until you find an answer you like). However, in this case, as noted, even they found that the BAB strategy generated significantly positive excess returns using equal weighting, rank weighting, or the conventional market-cap weighting. In addition, given the findings from other papers that low volatility (defensive) strategies have worked in all asset classes, the concern about transactions costs being excessive doesn’t seem to hold up.
Novy-Marx and Velikov also showed that the new (post the original BAB paper) factors of investment and profitability help explain much of the outperformance of the BAB factor (alternatively, it could be that they happen to correlate with BAB). That’s important as investors consider the best way to access factor premiums: Should they focus on low beta or the newer factors of investment and profitability? In addition, while the BAB factor is, like all factors, a long-short strategy, long-only funds can benefit from screening out high-beta stocks, especially small growth stocks with high investment and low profitability, penny stocks, and stocks in bankruptcy that drive the poor performance of securities in the highest quintile of beta. For example, firms such as Alpha Architect, Bridgeway Capital Management and Dimensional have long screened out such stocks. (Full disclosure: My firm, Buckingham Strategic Wealth, recommends Bridgeway and Dimensional funds in constructing client portfolios.)
Finally, it is important to note that the original BAB strategy is based on economic theory that was first espoused about 50 years ago by Fisher Black, among others. For those interested in learning more about the subject, in our book Your Complete Guide to Factor-Based Investing, Andrew Berkin and I provide a detailed description of the economic theory behind BAB and supporting evidence from academic research.
Performance figures contained herein are hypothetical, unaudited and prepared by Alpha Architect, LLC; hypothetical results are intended for illustrative purposes only. Past performance is not ...
more

