

Image Source: Unsplash
Recall the preliminary benchmark deducted 818K from the March NFP reading.
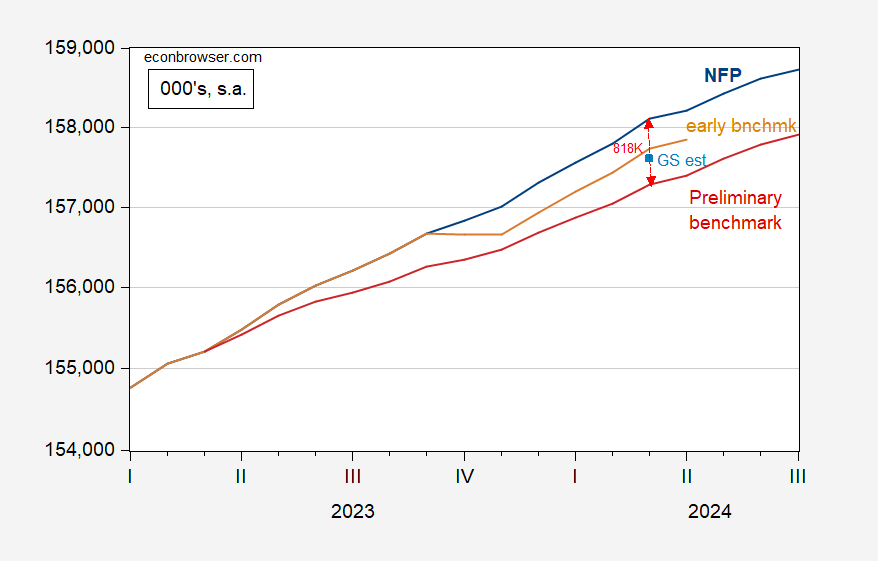
Figure 1: Level of nonfarm payroll employment from CES (blue), implied from CES preliminary benchmark (red), from Philadelphia early benchmark (tan), Goldman Sachs estimate of preliminary revision (light blue). Early benchmark calculated using ratio of sum-of-states early benchmark to sum-of-states. Source: BLS via FRED, BLS, Philadelphia Fed, and author’s calculations.
Why is the Goldman Sachs estimate so much closer to the Philadelphia Fed’s early benchmark? Previously, GS argued the underreporting of employment of unauthorized immigrants might explain the disjuncture, since the preliminary benchmark is based on QCEW figures which require SSN’s etc. In a note today, GS notes the preliminary benchmark downward revisions larger in states and industries with larger shares of unauthorized immigrants. Chart 2 from Peng and Mericle, Goldman Sachs, today.
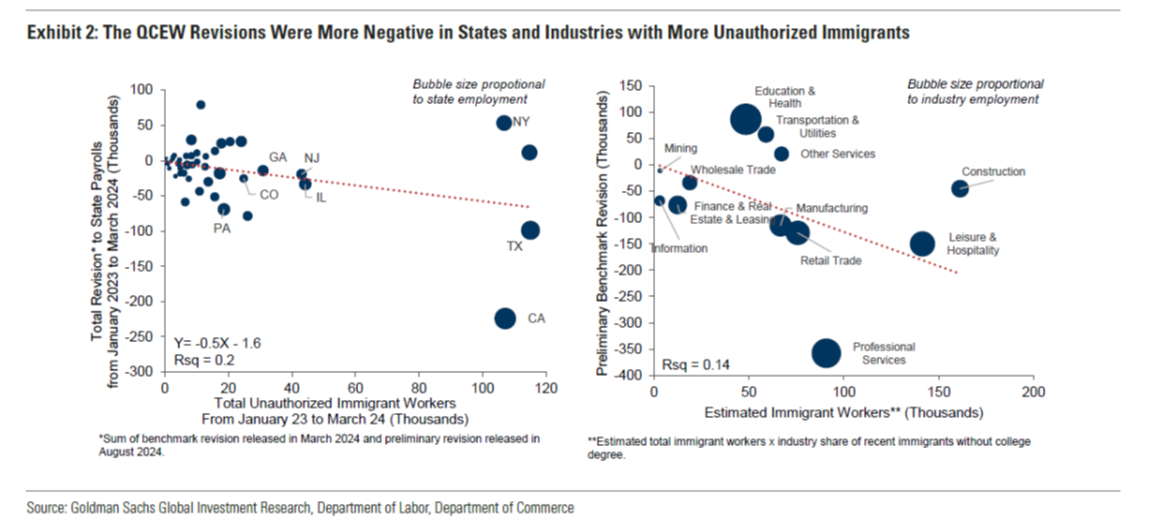
Source: Peng, Mericle, “US Daily: Q&A on the Effect of Immigration on the Preliminary
Benchmark Revisions to Payrolls,” Goldman Sachs, 30 August 2024.
What about the CPS series adjusted to the NFP concept. Considering the likely undercounting of immigrants implicit in the BLS population controls, it makes sense to look at an adjusted adjusted series. This shows up as follows:
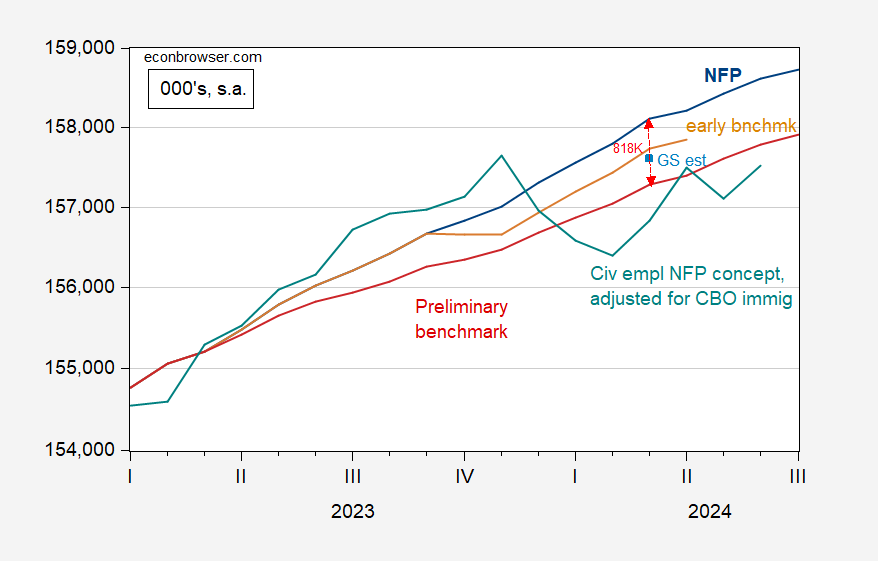
Figure 2: Level of nonfarm payroll employment from CES (blue), implied from CES preliminary benchmark (red), from Philadelphia early benchmark (tan), Goldman Sachs estimate of preliminary revision (light blue), and CPS series adjusted to NFP concept, adjusted to account for CBO estimates of immigration (see text here) (teal), all in 000’s, s.a. Early benchmark calculated using ratio of sum-of-states early benchmark to sum-of-states. Adjusted CPS series adjusted using ratio of employment under alternative to BLS research series. Source: BLS via FRED, BLS, Philadelphia Fed, and author’s calculations.
More By This Author:
Business Cycle Indicators As Of August’s EndWe Never Left The Recession Of March 2020 And … Everything Has Been Getting Gradually Worse
GDP 2nd Release For Q2


Comments
Log in or sign up to join the conversation.