
As of today:
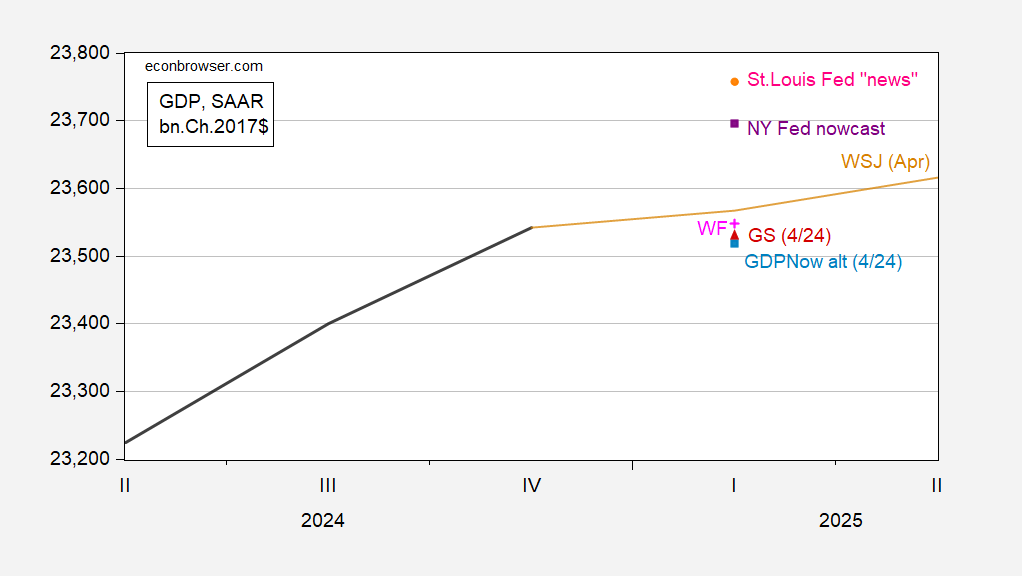
Figure 1: GDP (bold black), GDPNow adjusted for gold imports, 4/24 (light blue square), GS, 4/24 (red triangle)), Wells Fargo, 4/25 (pink +), NY Fed, 4/25 (purple square), St. Louis Fed, 4/25 (red circle), WSJ April survey mean (tan line), all in bn.Ch.2017$ SAAR. Source: BEA, Atlanta Fed, Goldman Sachs, Wells Fargo, NY Fed, St. Louis Fed, WSJ April survey, and author’s calculations.
More By This Author:
Business Cycle Indicator Sit-RepRecession Now? The Message From (Final Rev’d) Michigan Expectations Vs. PMI And CISS
Rising Expected Unit Cost Inflation Quantified


Comments
Log in or sign up to join the conversation.