
Margin Debt And The Market: Up 5.3% In May
Let's examine the numbers and study the relationship between margin debt and the market, using the S&P 500 as the surrogate for the latter.
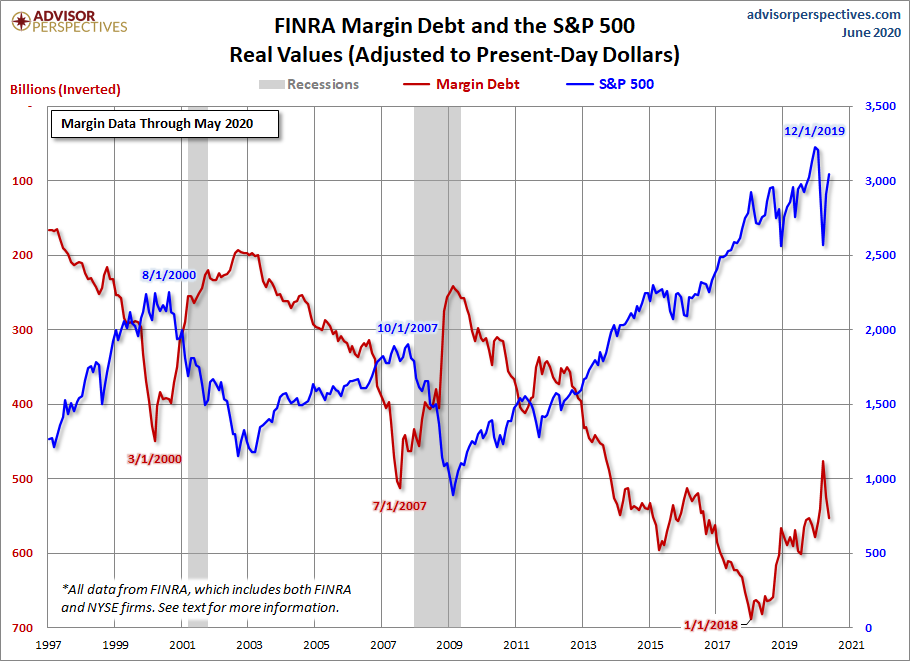
The first chart shows the two series in real terms — adjusted for inflation to today's dollar, using the Consumer Price Index as the deflator. At the 1997 start date, we were well into the Boomer Bull Market that began in 1982, and approaching the start of the Tech Bubble that shaped investor sentiment during the second half of the decade.
The astonishing surge in leverage in late 1999 peaked in March 2000, the same month that the S&P 500 hit its all-time daily high, although the highest monthly close for that year was five months later in August. A similar surge began in 2006, peaking in July 2007, three months before the market peak.
Debt hit a trough in February 2009, a month before the March market bottom. It then began another major cycle of increases.
The Latest Margin Data
FINRA has released new data for margin debt, now available through May. The latest debt level is up 5.3% month-over-month.

At the suggestion of Mark Schofield, Managing Director at Strategic Value Capital Management, LLC, we've created the same chart with margin debt inverted so that we see the relationship between the two as a divergence.
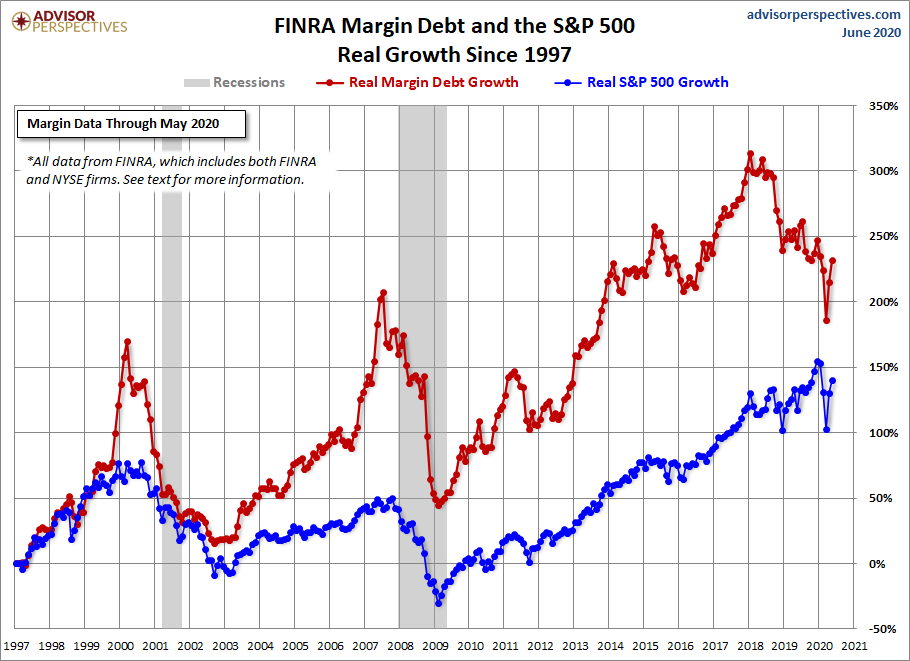
The next chart shows the percentage growth of the two data series from the same 1997 starting date, again based on real (inflation-adjusted) data. We've added markers to show the precise monthly values and added callouts to show the month.
Margin debt grew at a rate comparable to the market from 1997 to late summer of 2000 before soaring into the stratosphere. The two synchronized in their rate of contraction in early 2001. But with recovery after the Tech Crash, margin debt gradually returned to a growth rate closer to its former self in the second half of the 1990's, rather than the more restrained real growth of the S&P 500.
But by September of 2006, the margin again went ballistic. It finally peaked in the summer of 2007, about three months before the market. As of the February 2020 close and the March 2020 market top, we see that the debt peak was January 2018, 23 months before the market.
NYSE Investor Credit
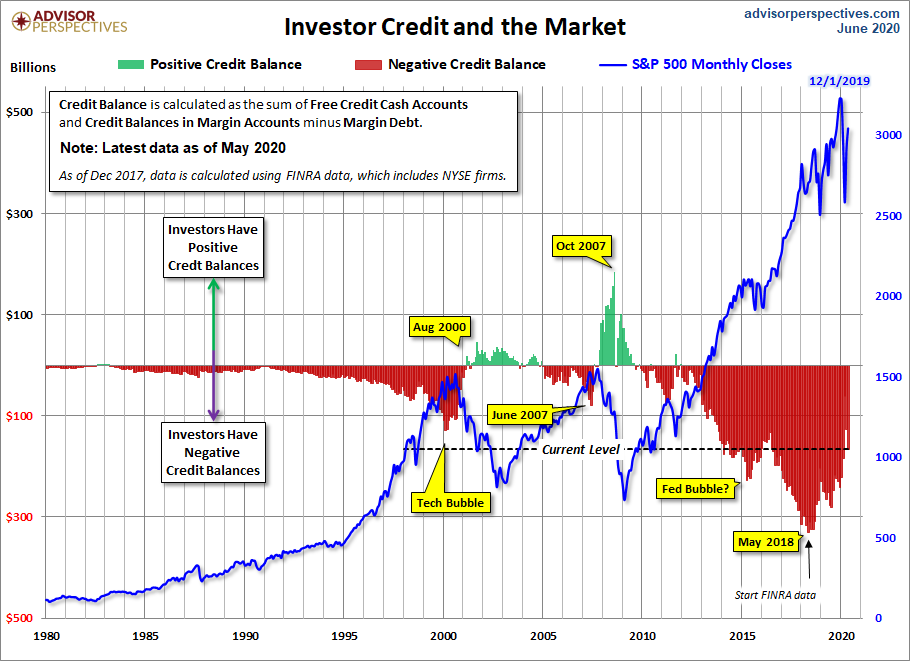
Lance Roberts of Real Investment Advice analyzes margin debt in the larger context that includes free cash accounts and credit balances in margin accounts. Essentially, he calculates the Credit Balance as the sum of Free Credit Cash Accounts and Credit Balances in Margin Accounts minus Margin Debt.
The chart below illustrates the mathematics of Credit Balance with an overlay of the S&P 500. Note that the chart below is based on nominal data, not adjusted for inflation. Here, we have retained the NYSE data through November 2017 and switched to the FINRA data.
Here's a slightly closer look at the data, starting with 1997. Also, we've inverted the investor credit monthly data and used markers to pinpoint key turning points.
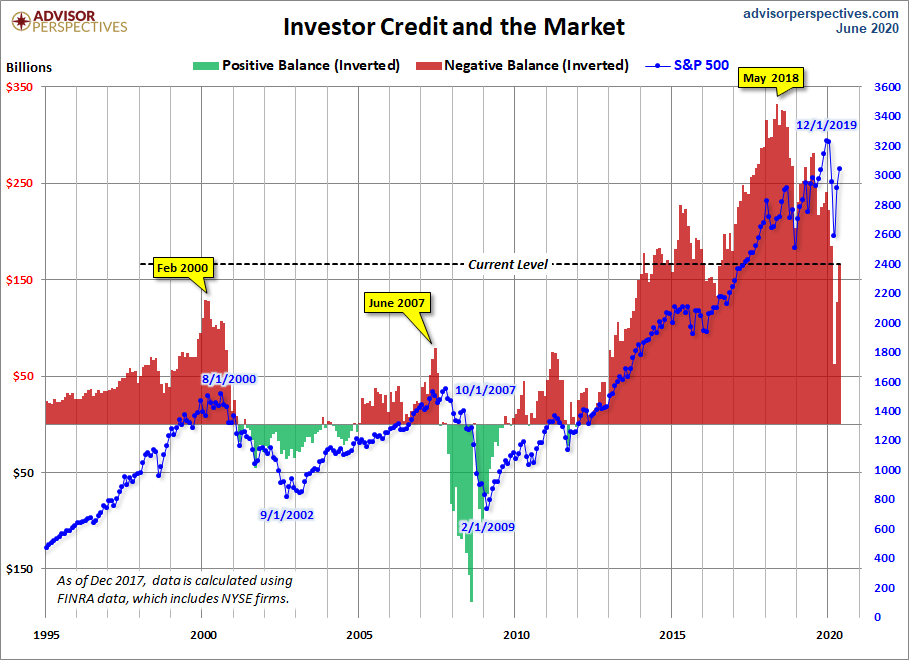
As we pointed out above, margin debt data is several weeks old when it is published. Thus, even though it may, in theory, be a leading indicator, a major shift in margin debt isn't immediately evident.
Nevertheless, we see that the troughs in the monthly net credit balance preceded peaks in the monthly S&P 500 closes by six months in 2000 and four months in 2007. Before the December 24, 2018 correction of 19.78%, the previous S&P 500 correction greater than 15% was the 19.39% selloff in 2011 from April 29th to October 3rd. Investor Credit saw a negative extreme in March 2011.
As of the February data and knowing that we are now past the longest bull market in history, the peak in margin debt preceded the peak in the monthly S&P closes by 19 months; much longer than the previous shifts prior to corrections.
Conclusions
There are too few peak/trough episodes in this overlay series to take the latest credit balance data as a leading indicator of a major selloff in U.S. equities. This has been an interesting indicator to watch and will certainly continue to bear close watching in the future.
Note: The NYSE has suspended its NYSE Member Firm margin data as of December 2017. We have replaced our Margin Debt data with FINRA data, which includes data for all firms, not just NYSE member ...
more


It is a known fact that low rates encourage debt and it is also becoming a known fact that more and more people are finding out that it is impossible to get ahead these days without investing. What is good about margin debt is that people choose to take debt to invest as opposed to taking regular debt to spend. The simple fact remains, if the Federal Reserve or policy makers want to help the market they can do things to lower the rate on margin debt. For many the rates remain too high to be of any benefit for the average investor which is the real worry (the margin debt may be acts of irrationality rather than wise choices).