
So much for a manufacturing renaissance, post-“Liberation Day”.
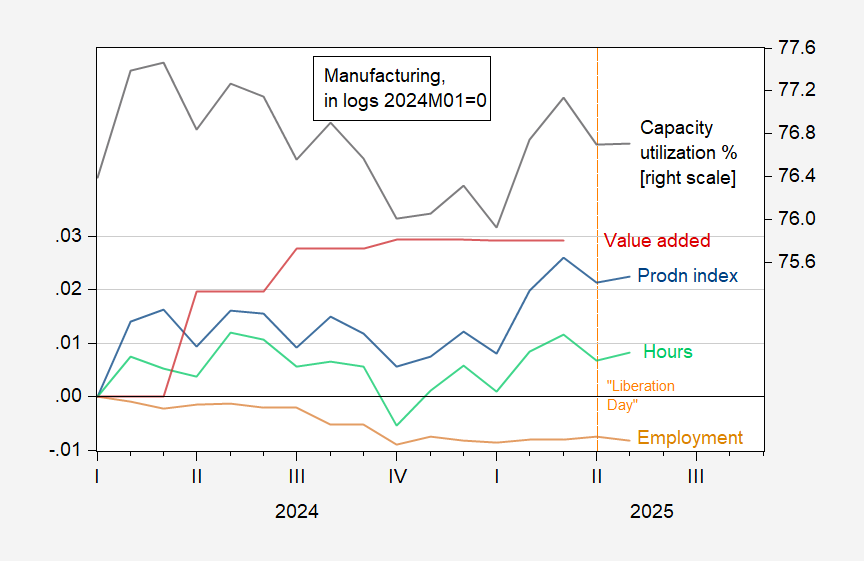
Figure 1: Manufacturing production (blue), value added in 2017$ (red), employment (tan), hours (light green) all in logs, 2024M04=0; and capacity utilization (NAICS), % (black, right scale). Aggregate hours of production workers calculated by multiplying average weekly hours by employees. Source: Federal Reserve, BEA, BLS, and author’s calculations.
More By This Author:
Industrial And Manufacturing Production, Real Retail Sales – Business Cycle Indicators
Tariffs And Consumer Prices At High Frequency
Slowdown? Business Cycle Indicator Data As Of Mid-June


Comments
Log in or sign up to join the conversation.