
So the sector overall looks like it’s in the doldrums:
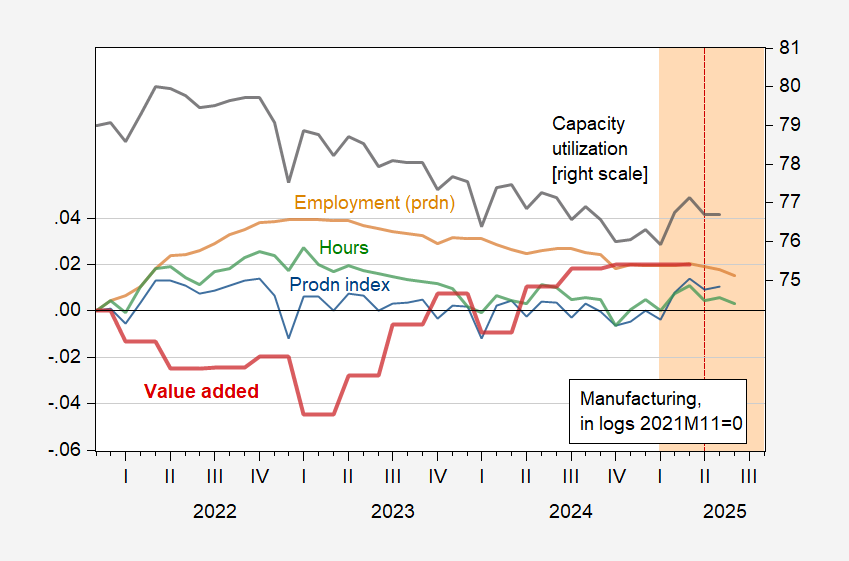
Figure 1: Manufacturing production (blue), value added in 2017$ (red), employment (production and nonsupervisory) (tan), hours (light green) all in logs, 2024M04=0; and capacity utilization (NAICS), % (black, right scale). Aggregate hours of production workers calculated by multiplying average weekly hours by employees. Dashed red line at “Liberation Day”. Source: Federal Reserve, BEA, BLS, and author’s calculations.
Manufacturing ISM PMI (new orders) still down:
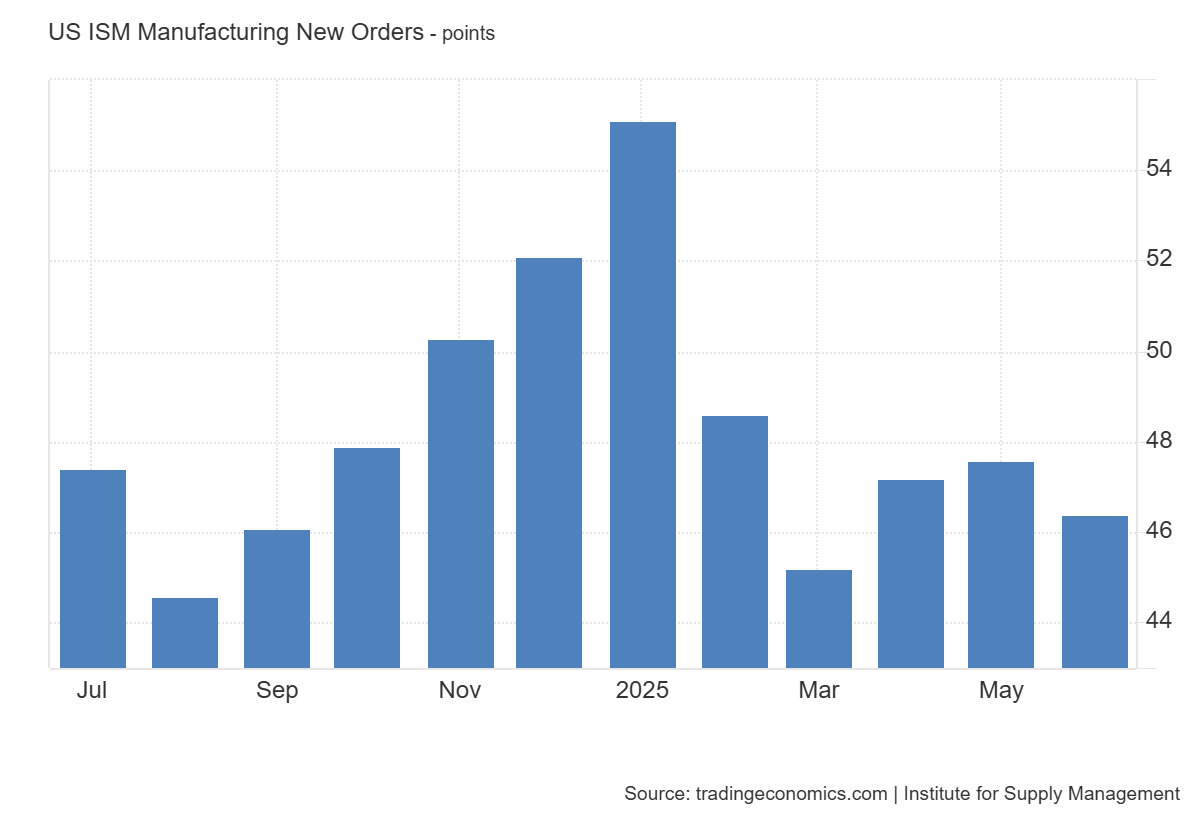
Source: TradingEconomics.com accessed 7/5.
EJ Antoni notes the slide in manufacturing employment, but pins his hopes on trade “deals”, to wit:
Slide in manufacturing jobs continued in Jun, in line w/ survey data from PMIs, regional Fed banks, and others; if trade deals can be reached soon, this will likely reverse; remember that more than half of what we import in the U.S. are inputs that will eventually be exported.
With two “deals” (more like a memoranda of understanding) set, still about 88 to go by Wednesday, or…
More By This Author:
Central Bank Gold HoldingsFinal Sales To Private Domestic Purchasers Nowcasts Decelerate
Business Cycle Indicators – June Employment Release And May Monthly GDP


Comments
Log in or sign up to join the conversation.