
This morning, US data showed a larger-than-expected increase in people applying for jobless benefits—258k for the week of October 5, versus 230k expected—a 14-month high.
There was also a .2% month-over-month increase in headline CPI, double the .1% expected by the consensus. Fewer jobs and a higher cost of living remain an increasing challenge for households that drive the bulk of spending in Western economies.
While governments have continued to expand debt and public sector job rolls, the private sector is focused on cutting overhead. US private job growth in September was -.4% year-over-year, a contraction only seen during recessions over the past 80 years.
In Canada, barely 50% of those looking for work in the last year found a job. The Canadian unemployment rate, at 6.6% in September, was the highest in three years, higher than before the pandemic and 180 basis points above the cycle low two years ago—again, a rate of change only seen during past recessions.
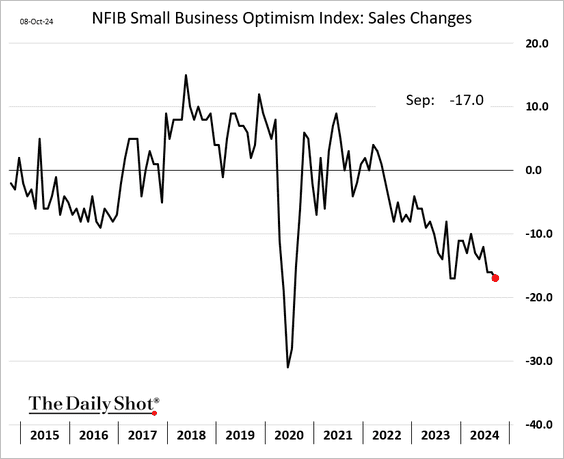
Small businesses drive the bulk of job growth in the economy, and the September NFIB small business optimism index showed that seventeen percent saw lower sales, which is the most pessimistic outlook since the pandemic (shown below since 2015, courtesy of The Daily Shot).
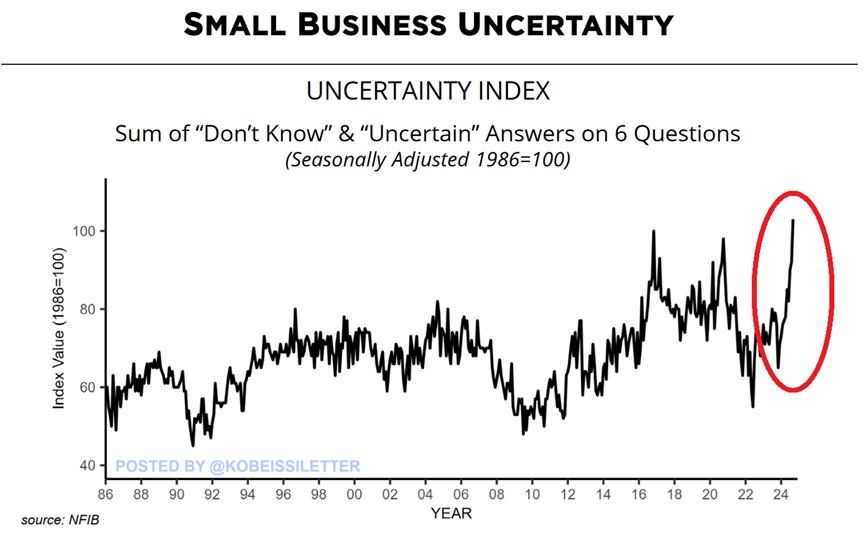
With bankruptcy filings surging, the share of small businesses reporting uncertainty about their future is at the highest in at least 40 years surveyed (shown below since 1986, courtesy of the Kobeissi letter).
At the same time, large-cap stocks have continued to climb, now at the highest valuations in history. In just one historically insightful measure, the so-called Buffett Indicator, the market price of US stocks as a ratio of US economic output (GDP) was 209% at the end of August, more than two standard deviations (68%) above the historical trend line since 1950 (as shown below, courtesy of Current Market Valuation).
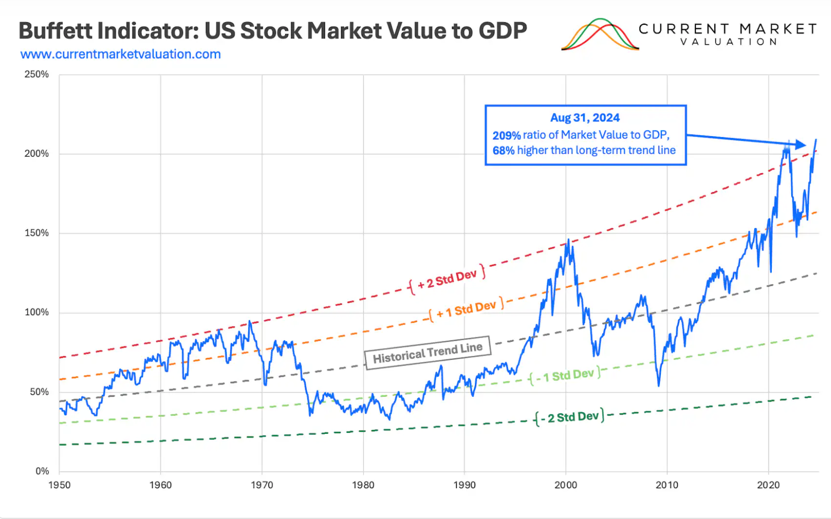
There has never been a time when stock prices did not mean-revert well below their long-term average once valuations touched far above long-term norms—each correction period wrought capital destruction that took years to make back losses. Most who held at the cycle tops ended up liquidating near cycle lows and missed the eventual rebound.
The timeless irony is that capital risk is highest when asset valuations are highest and lowest when valuations are lowest. Today, asset valuations/capital risk have never been higher, yet the masses are mostly oblivious to this reality.
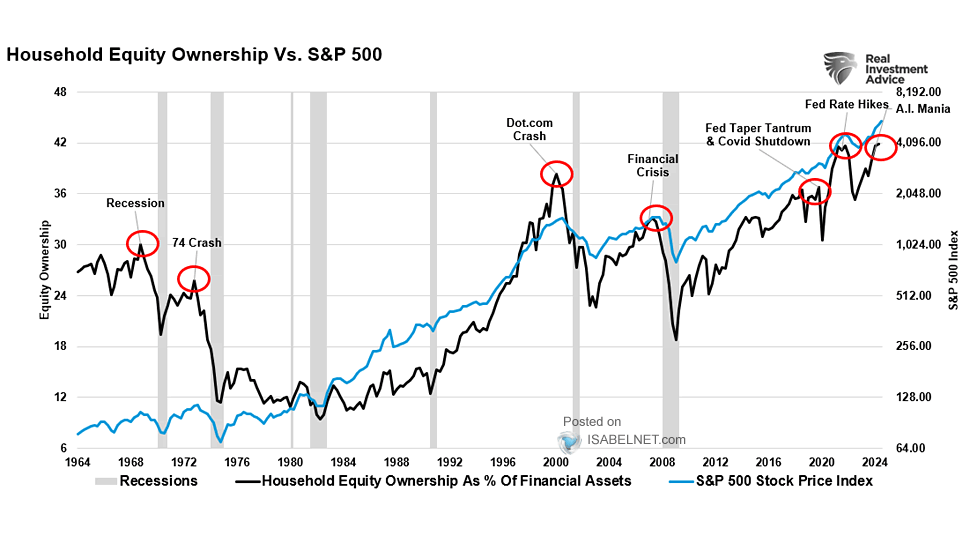
Most have little in the way of stored savings, and the widespread financial plan, aided and abetted by the risk-promoting financial sector, is a record weight in double or nothin’ bets with stocks at all-time highs (black line below since 1964, courtesy of Real Investment Advice within blue). Equity market exposure repeatedly peaks (red circles) at the onset of recessions (grey bars) and then tumbles as bear markets unfold.
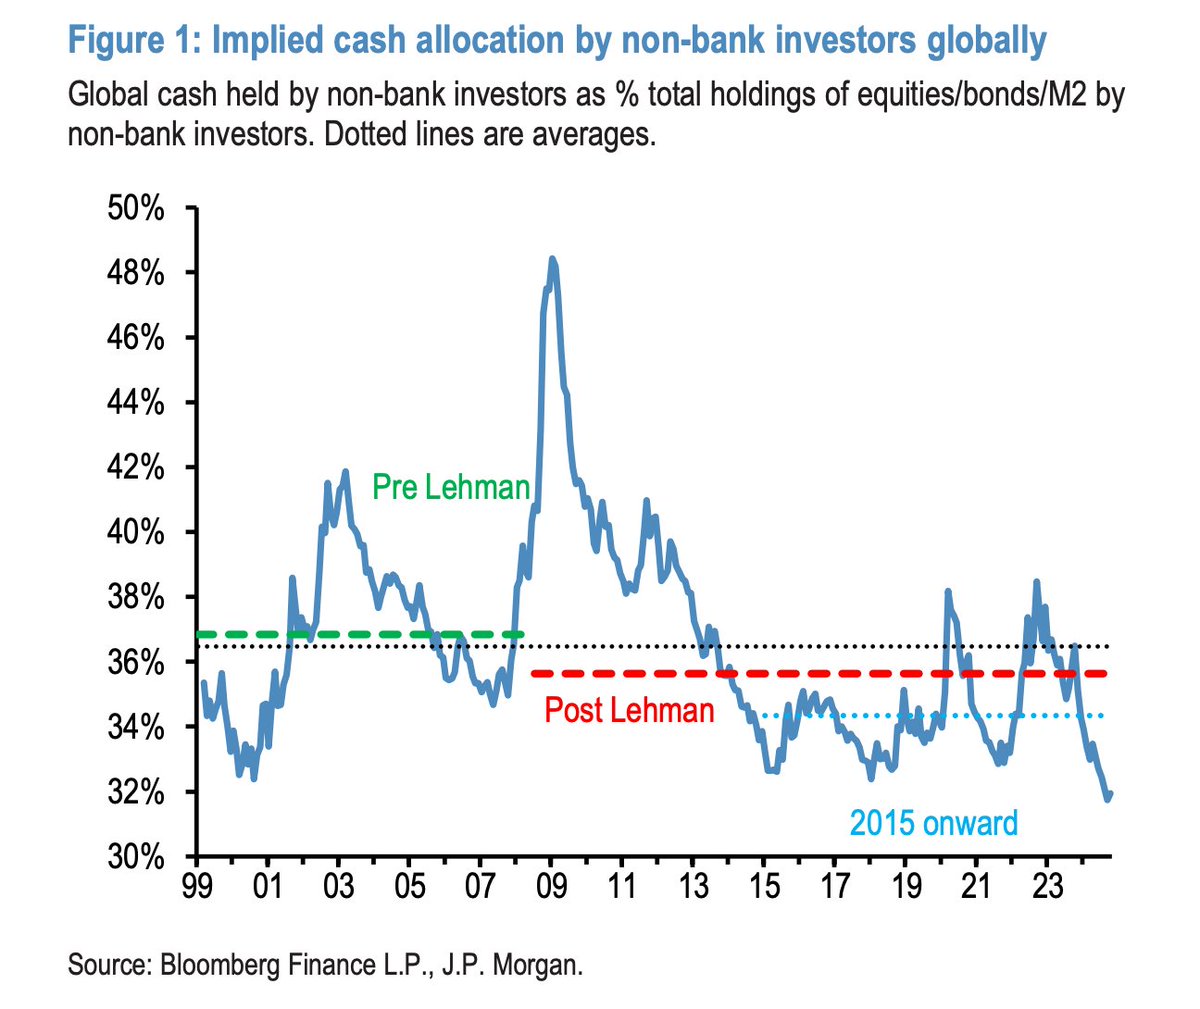
Today, the lowest level of cash held by investors in more than 25 years (below since 1999, courtesy of JP Morgan) further magnifies financial risk for households and the economy.
More By This Author:
Realty Bubble Bursting As Power Of Sales Spread
Canadian Rough Patch Getting Rougher
China Launches Next Wave Of Asset Propping Efforts

Comments
Log in or sign up to join the conversation.