

Image Source: Pexels
ICE raids are concentrated in blue states, including CA, NY. These states account for about 22% of national GDP, at nominal prices (CA 14%, NY 8%; slightly larger if using real GDP):
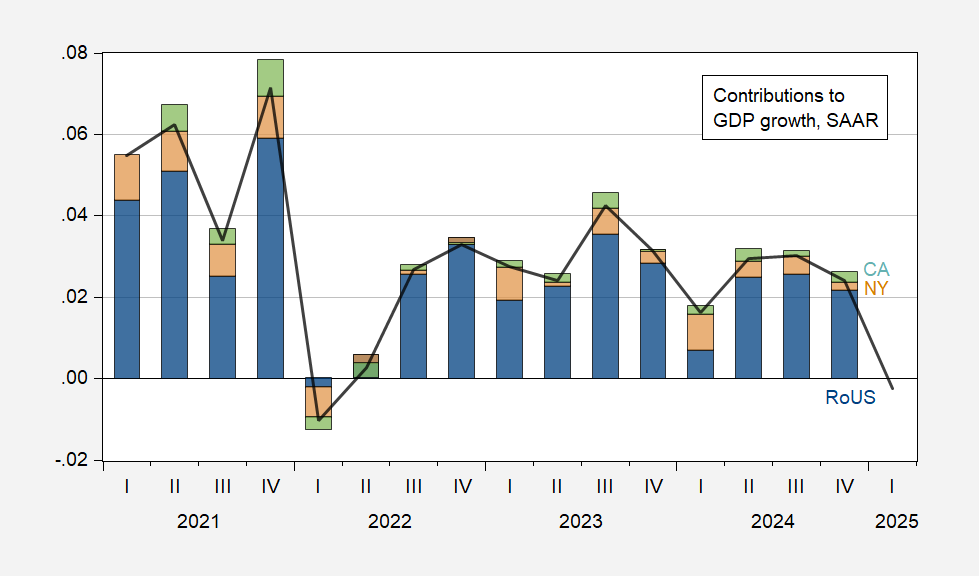
Figure 1: US GDP growth (black line), contribution from California (green bar), from NY (tan bar), rest-of-US (blue bar), ppts SAAR.
We don’t have Q1 GDP for CA or NY, and in any case, Q1 national GDP is distorted by import tariff front-running. We do have Q1 growth deviation from the national trend from the Baumeister, Leon-Leiva, and Sims weekly state level economic conditions index:
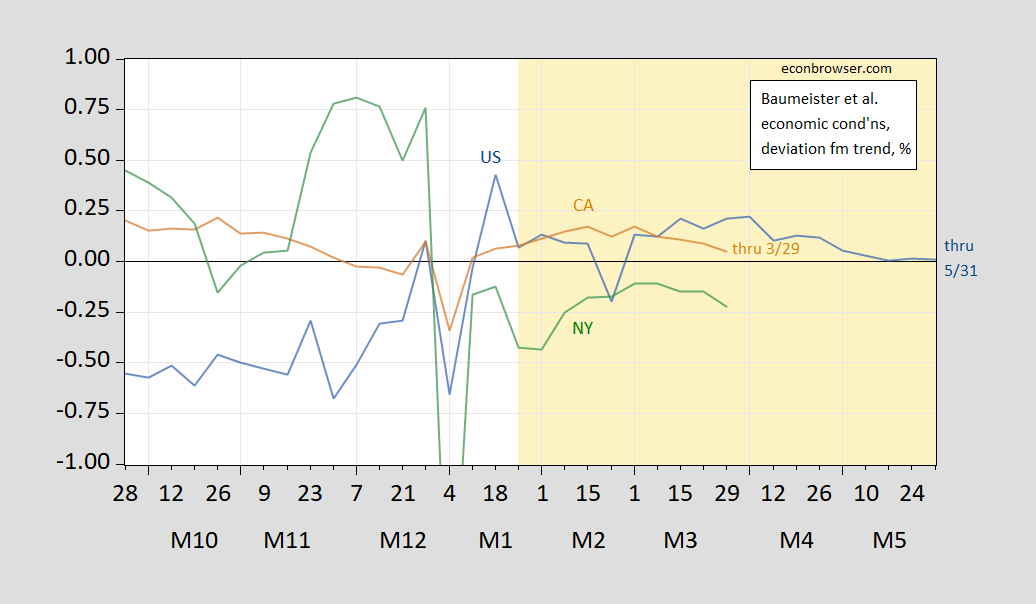
Figure 2: Weekly Economic State-Level Conditions Index for US (blue), California (tan), NY (green), % deviation from national trend. Source WECI.
So for Q1, California GDP growth is projected to be approaching national trend growth (where California trend is above US trend), and NY is already dipping below.
The UCLA Andersen Forecast is for approximately zero NFP employment growth for 2025. The CA Department of Finance official forecast is for 0.6% (0.2%) annualized civilian employment growth in 2025Q1 (2025Q2), and 0.2% (0.4%) annualized NFP growth.
With these continued ICE raids and mass removals and deportations, the administration’s objective of sowing confusion and fear is likely working. With this comes policy uncertainty. The EPU for California extends to December:
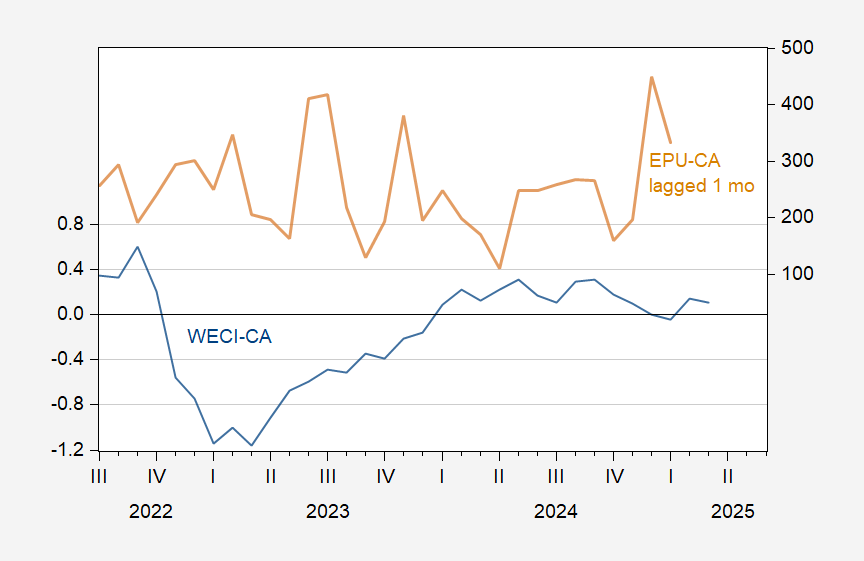
Figure 3: Weekly State-level Economic Conditions index for California, % deviation from national trend (blue), EPU for California (tan, right scale). Source: WECI and policyuncertainty.com.
If state-level economic conditions are affected by uncertainty in the same manner as national, then any elevated policy uncertainty in California will have a depressing effect on economic activity.
More By This Author:
In Case You Thought Policy Uncertainty Had DeclinedMichaillat-Saez Recession Indicator
May Employment Release: NFP Above Consensus, Mfg Below


Comments
Log in or sign up to join the conversation.