
Low Long Term Rates To Stay?
As I begin teaching finance in the new semester, I am highlighting the key puzzle of our times, discussed by Jim in his last post, with this graph:
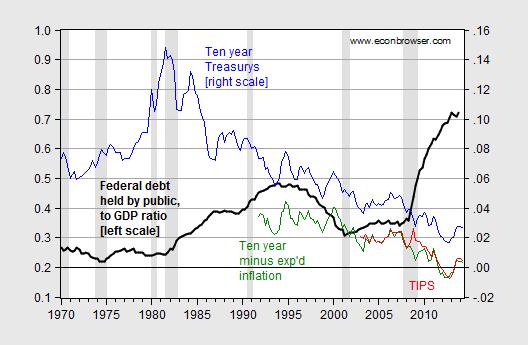
Figure 1: Ratio of Federal debt held by public to GDP (bold black, left scale), ten year constant maturity Treasury yield (blue, right scale), ten year Treasury yields minus ten year median expected inflation (green, right scale), and TIPS ten year constant maturity yields (red, right scale). NBER defined recession dates shaded gray. Source: Treasury, Federal Reserve Board, BEA (2014Q2 2nd release), Survey of Professional Forecasters, NBER, and author’s calculations.
The key point of this graph is that the US debt-to-GDP ratio has risen, starting upward in 2008Q3; and yet nominal ten year yields have continued to decline, despite the warnings of Paul Ryan, and others, contra the crowding out hypothesis. Some of this decline can attributed to a decline in expected inflation, but not by any means most. Real interest rates calculated using yields minus expected inflation have also declined. Aside from the financial turmoil surround Lehman’s collapse, TIPS yields confirm the decline.
Why have government yields declined so much, despite the reversal in the debt-GDP ratio engineered by the Bush Administration (remember EGTRRA and JGTRRA?). About ten years ago, Jeff Frankel and I started investigating this puzzle [1]. We regressed US yields on actual and expected US debt-GDP ratios (annual data), and found that up to 2002, the canonical regression worked well. But incorporating data up to 2006, the correlation broke down — and yields were over-predicted. This finding was one manifestation of the “conundrum”. Only by incorporating foreign purchases of US Treasurys could we restore the correlation (and fit the data).
So, looking forward, what can we expect to happen to yields, given foreign and Fed holdings of US Treasurys? First a regression over the 1991Q4 to 2002Q4 period.
rt = 0.026 + 0.071×dt -0.348×fedt – 0.067×fort + 0.253×yt-1
Adj.-R2 0.34, SER = 0.005, DW=0.91, n=45. bold face denotes significance at the 10% MSL, using HAC robust standard errors. Where r is the ten year real interest rate, d is debt-to-GDP, for is foreign and international holdings of Treasurys and Fed is holdings by the Federal Reserve Banks (both normalized by GDP), and y is the output gap, measured using the log of the ratio of GDP to the CBO estimate of potential GDP (February 2014 release).
For each 1 percentage point increase in the debt-to-GDP ratio, the Treasury yield rises by 0.07 percentage points. This estimate is similar to the figure obtained in Chinn and Frankel for the period 1988-2006. Interestingly, the coefficients on foreign and Fed holdings are not statistically significant.
Expanding the sample to 2014Q1, one obtains the following results:
rt = 0.023 + 0.073×dt -0.159×fedt – 0.130×fort + 0.223×yt-1
Adj.-R2 0.83, SER = 0.005, DW=0.76, n=90. bold face denotes significance at the 10% MSL, using HAC robust standard errors.
Including a time trend does not change the results (and the coefficient on the time trend is not significant in itself). Interestingly, the hypothesis that for and Fed are equal and opposite sign from that on d cannot be rejected at conventional levels (similar to Kitchen and Chinn (2012)).
The fit is much better using the full specification, as opposed to merely debt and output gap. This is shown in Figure 2.
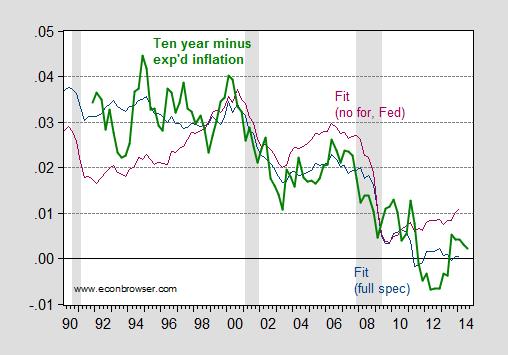
Figure 2: Ten year Treasury yields minus ten year median expected inflation (bold green), fitted values using full specification (dark blue), and using partial specification (purple). NBER defined recession dates shaded gray. Source: Federal Reserve, Survey of Professional Forecasters, NBER, and author’s calculations.
(Note: it would be preferable to use foreign official sector holdings, as opposed to foreign (private and public) holdings, but this is the series I could get on quick notice.)
While Fed holdings will stabilize and shrink over time, it’s not clear to me that foreign holdings expressed as a share of US GDP are going to shrink.
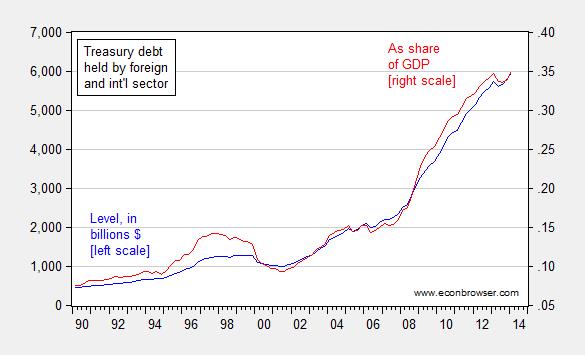
Figure 3: US Treasury debt held by foreign and international sector, in billions $ (blue, left scale), and as share of GDP (red, right scale). Source: Flow of funds, BEA, and author’s calculations.
In fact, in the short term, one can imagine elevated holdings of US Treasurys, given geopolitical concerns. Over the longer term, the demand for “safe assets” (see definition here and here) will likely continue, as financial development is a very slow process (and regressing in places like Russia).
In sum, I am not so sure the case for a rebound of long term rates to the norms of the post War era is so strong.
Update: See also DeLong/WCEG, who brings my attention to the blog review by Cohen-Setton/Bruegel.
Disclosure: None.


