Looking Backward To The “Recession Of 2022H1” And Forward To The Recession Of 2023
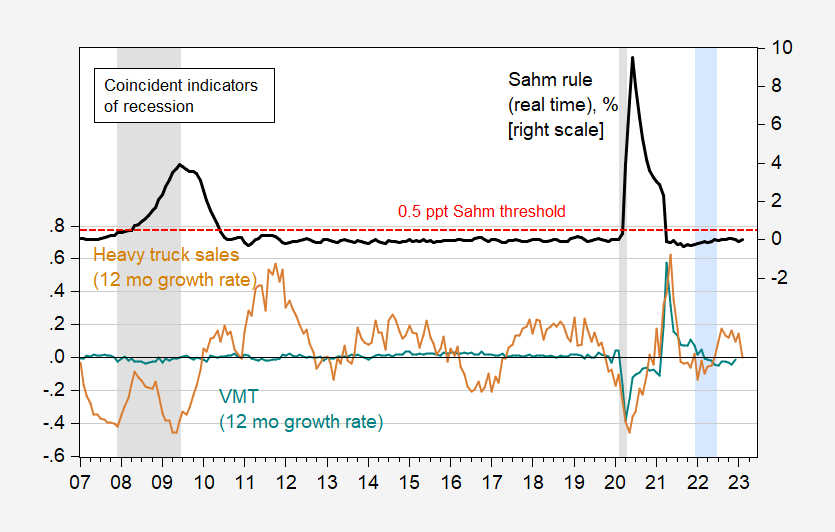
Ever wonder whether vehicle miles traveled (VMT) does a good job of predicting recessions? You should’ve stopped after looking at this Econbrowser post from January 4th, but I thought an update to most recent data would be of interest as we obtain December data. First take a look at what VMT does over recessions, versus heavy truck sales (suggested by Calculated Risk at some points), and the eponymous Sahm Rule (real time version).
Figure 1: 12 month growth rate in the vehicle miles traveled, n.s.a. (teal), in heavy truck sales, s.a. (tan), and Sahm rule indicator – real time (black). Sahm rule is 3 month moving average unemployment rate relative to lowest unemployment rate in last 12 months. Red dashed liine denotes threshold for Sahm rule indicator. NBER defined peak-to-trough recession dates shaded gray. Hypothesized 2022H1 recession shaded lilac. Source: FHA via FRED, Census via FRED, FRED, and NBER.
It’s hard to see, but the 12 month change in VMT declined a few months ago before recovering in December (it’s this decline that Mr. Steven Kopits pointed to), while heavy truck sales were up through January, y/y. The Sahm rule is exactly at zero as of the February data released yesterday (it needs 0.5 ppts to breach the threshold).
In any case, VMT growth is a lousy indicator of recession (McFadden R2 of 0.07) compared to heavy truck sales (0.28) (see regression results in this post).
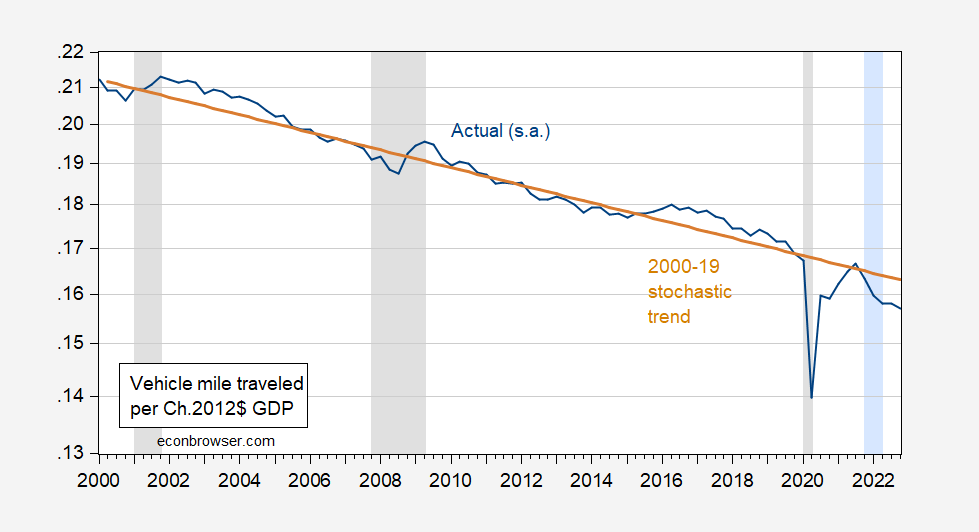
Looking forward, I would be even more careful about using VMT as an indicator, given that the relationship between VMT and GDP has seemingly experienced a structural break. In Figure 2 I plot Vehicle Miles Traveled (seasonally adjusted) at a quarterly rate per US GDP at a quarterly rate (so that the units are Vehicle Mile Traveled/real dollar GDP). There is an obvious trend at 1.15 percent decrease per year over the 2000-19 period. (I estimate a stochastic trend given I can’t come close to rejecting a unit root in the log ratio.) Using the estimated trend to project forward, I obtain:
Figure 2: Vehicle Miles Traveled per Ch.2012$ GDP (blue line), and stochastic trend estimated over 2000-19 (tan line), on log scale. NBER defined peak-to-trough recession dates shaded gray. Hypothesized 2022H1 recession shaded lilac. Source: FHA, BEA, NBER, and author’s calculations.
In other words, Mr. Kopits took the downshift to a seemingly new trend line as a cyclically induced reduction in VMT.
More By This Author:
Business Cycle Indicators And The Employment ReleaseThe Administration’s GDP Forecast
r vs. g


