Largest Discrepancy Between GDP And GDI In 20 Years
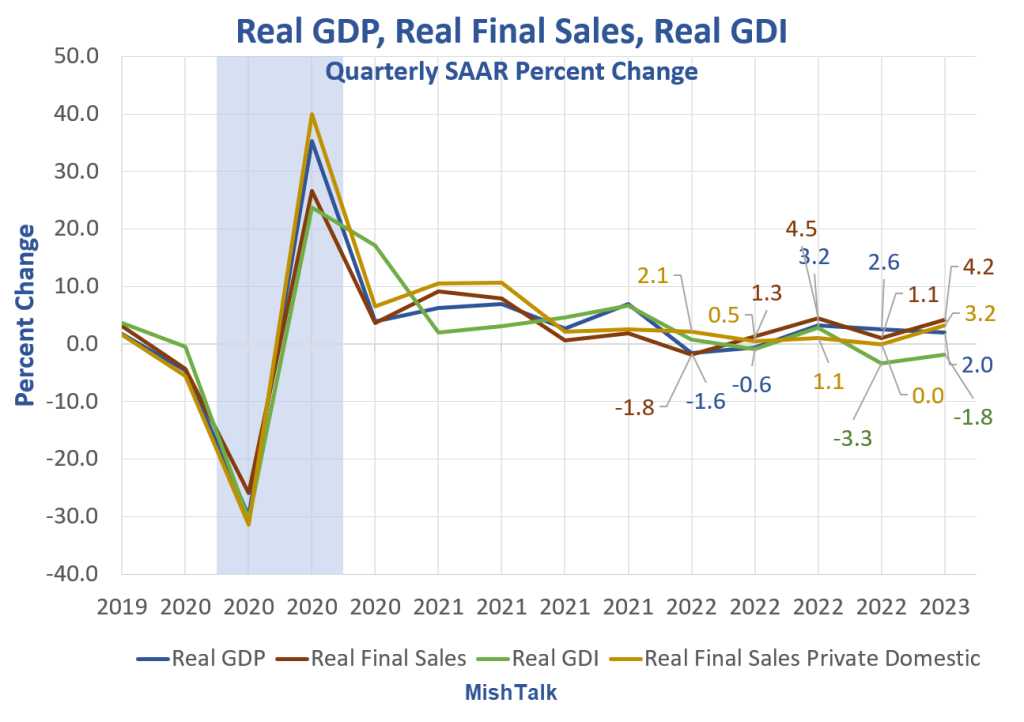
The BEA released its final estimate of first-quarter 2023 GDP. The GDP vs GDI discrepancy is one of the largest ever.

Real GDP, Real Final Sales, and Real GDI data from BEA, chart by Mish
Gross Domestic Product (GDP) and Gross Domestic Income (GDI) are two measures of the same thing. They are supposed to match, and will over time, with revisions in at least one of the measures.
Real Final Sales is the bottom line estimate of Real GDP. The word real, means inflation-adjusted.
Today the BEA released its Third Estimate of First Quarter 2023 GDP and an update on GDI as well.
BEA Highlights
- Real GDP increased at an annual rate of 2.0 percent in the first quarter of 2023 according to the “third” estimate released by the Bureau of Economic Analysis.
- In the fourth quarter of 2022, real GDP increased 2.6 percent.
- Real gross domestic income (GDI) decreased 1.8 percent in the first quarter, an upward revision of 0.5 percentage point from the previous estimate.
- The increase in first-quarter real GDP was revised up 0.7 percentage point from the second estimate, reflecting upward revisions to exports, consumer spending, state and local government spending, and residential fixed investment that were partly offset by downward revisions to nonresidential fixed investment, federal government spending, and private inventory investment. Imports were revised down.
- The average of real GDP and real GDI, a supplemental measure of U.S. economic activity that equally weights GDP and GDI, increased 0.1 percent in the first quarter, an upward revision of 0.6 percentage point from the previous estimate.
The BEA averages GDP and GDI on the basis that it does not know which measure is more accurate. The NBER, the official arbiter of US recessions does the same thing.
However, the NBER is so late in issuing its recession calls, it will be clear which one of the current estimates is more accurate.
Largest Discrepancy in at Least 20 Years
Over the last two quarters GDP has grown at a 2.3% annual rate while GDI has fallen at a 2.6% annual rate.
— Jason Furman (@jasonfurman) June 29, 2023
That's the largest discrepancy in these 2 ways of measuring the same thing in at least twenty years.
(This statement is based on comparable historical vintages.) pic.twitter.com/WAlJdclOmL
Q&A on the Discrepancy
Yes, which are only easily available for the last twenty years. Revisions generally move them more closely together. But would need to move them more than usual for the gap to still not be unusually large compared to historical revised data.
— Jason Furman (@jasonfurman) June 29, 2023
The average is very weak, near-zero growth letting everyone believe what they want about the strength of the economy. The divergence between jobs and employment is also in play.
Jobs vs Employment Discrepancy

Nonfarm payrolls and employment levels from the BLS, chart by Mish.
I have been covering the discrepancy between jobs and employment for over a year.
My most recent update was on June 2, in Huge Jobs Divergence Returns, Jobs +339,000 but Employment -310,000
Payrolls vs Employment Since May 2022
- Nonfarm Payrolls: +4,063,000
- Employment Level: +2,422,000
- Full Time Employment: +1,734,000
Of the 894,000 rise in employment in January, 810,000 was due to annual benchmark revisions. And the BLS does not say what months were revised, just poof, here you go.
Think There’s a Strong Labor Market? Then Think Again

Hours worked data from the BLS, chart by Mish
Hours worked data from the BLS, chart by Mish

Across the board, people are working much fewer hours per week than pre-pandemic.
The hours view and the employment vs jobs view hints that the GDI view is closer to the mark than the GDP view. For discussion, please see Think There’s a Strong Labor Market? Then Think Again
More By This Author:
Fed Chair Jerome Powell Hints At No Interest Rate Cuts Until 2025
Ford To Layoff At Least 1,000 Workers, EV Startup Lordstown Motors Dies
Disingenuous Claims By President Biden On The Number Of Jobs He Created
Disclaimer: Click here to read the full disclaimer.


