
Labor Force Developments
Nationwide, labor force down 2.7% from February, and down 2.4% from year ago.

Figure 1: Civilian labor force, 000’s, s.a. Red arrow denotes year-on-year decline. NBER defined recession dates. A NBER peak was declared for February 2020. Source: BLS via FRED, NBER, and author’s calculations.
In other words, the labor force declined in September, indicating that the labor market recovery has at a minimum slowed, and the scarring effects are getting more pronounced as more people drop out of the labor force administratively defined. (One has to be careful about inferring trends from m/m changes, particularly at the statewide level when it comes to household survey based figures.)
Two days ago, state statistics — which are subject to greater measurement error and calculated using a different methodology — indicated variability in the labor force decline.
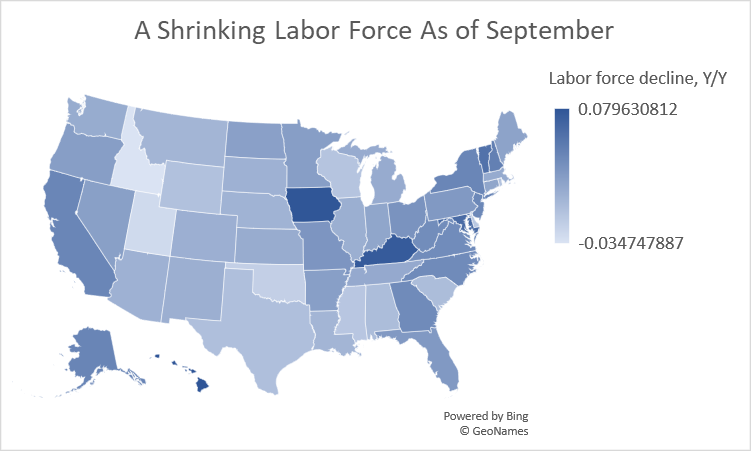
Figure 2: Labor force decline, year-on-year (darker denotes larger percent decline). 0.0796 denotes 7.96% decline from September 2019. Source: BLS and author’s calculations.
Disclosure: None.


