
ISM Non Manufacturing Index Near A Three Year Low
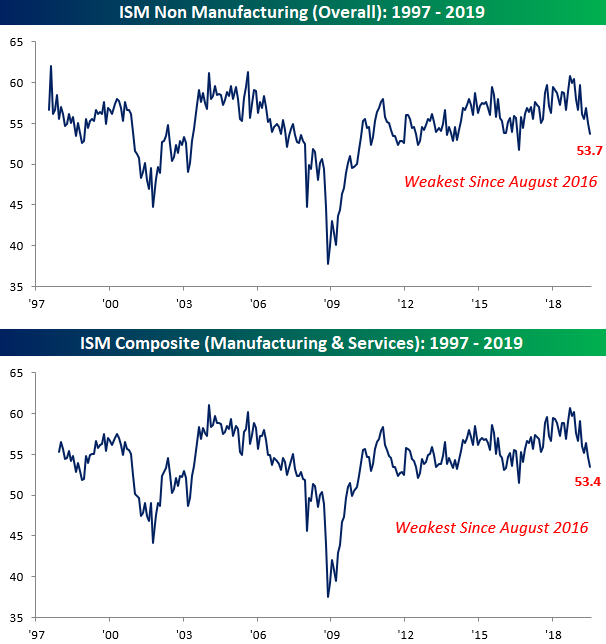
Just like its manufacturing counterpart last week, the July release of the ISM Non-Manufacturing survey came in shy of consensus expectations. While economists were expecting the headline reading to increase slightly from 55.1 to 55.5, the actual reading came in at 53.7. That’s a level that is still consistent with steady growth, but it is also the weakest reading since August 2016. Similarly, on a combined basis and accounting for each sector’s share in the economy, the combined Composite PMI for July came in at 53.4, which was the lowest reading since August 2016.
(Click on image to enlarge)
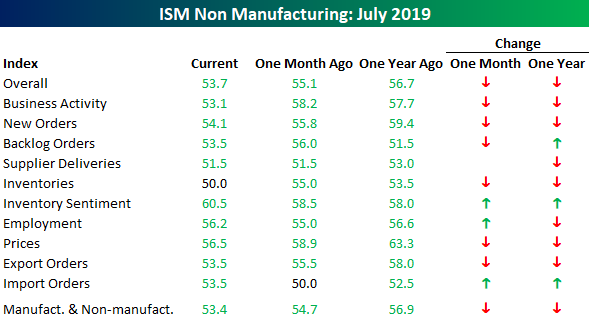
The table below breaks down the July ISM Services report by each of its sub-components and shows their m/m and y/y changes. Breadth in this month’s report was biased to the downside. Compared to June and last year, just three components showed increases.
(Click on image to enlarge)
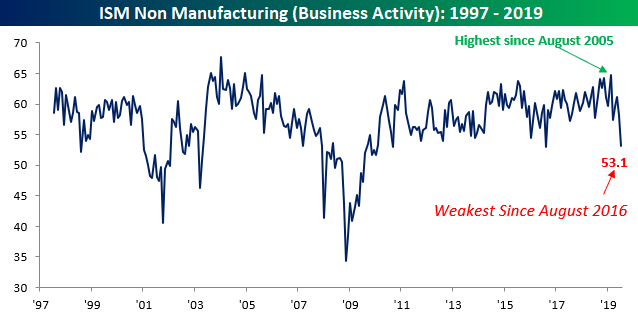
One of the biggest decliners on both a m/m and y/y basis was Business Activity. After hitting its highest level since August 2005 back in March, the index is now at its lowest level since August 2016. Overall, the July ISM Services report wasn’t a disaster, but it certainly wasn’t a picture of strength either.
(Click on image to enlarge)
Start a two-week free trial to Bespoke Institutional to access our interactive economic indicators monitor and much ...
more

