Is Money Or Logistics The Origin Of U.S. Inflation?
What is the Origin of U.S. Inflation?
When it comes to U.S. inflation, the generally accepted line of argument is that it is a result of surging demand and supply chain challenges. Like so many tropes repeated by media in recent years (whether true or not, every sentence about Trump’s election challenge had the words ‘false’ or ‘baseless’ and every mention of vaccines had the phrase ‘safe and effective’) we are seeing media routinely add the phrase ‘due to surging demand and supply chain constraints’ next to every mention of inflation. On the other hand, there is a minority of generally conservative commentators who argue that monetary supply and government spending are driving inflation.
So, who’s right?
This is not simply an academic exercise. The answer has deep implications for public policy and can affect all of our economic futures. If the U.S. were to enter a spiral of massive inflation caused by monetary growth the country would be dramatically weakened. Liabilities are officially measured at 30 trillion dollars, but with future liabilities included, many estimates total U.S. liabilities in excess of $130 trillion. A great deal of that can be inflated away (at a significant cost to the elderly and others dependent on transfer payments). But if the U.S. dollar is devalued, then government borrowing rates could skyrocket leading to global instability. Similar situations have led to chaos. The runup to the French Revolution (among others) was preceded by an effective government bankruptcy.
However, if the current inflation is simply the result of short-term demand and supply chain challenges then it will ‘work itself out’ with a short, one-time, devaluation. Government spending can proceed apace without risk to U.S. preeminence and social stability.
So how can we tell who’s right?
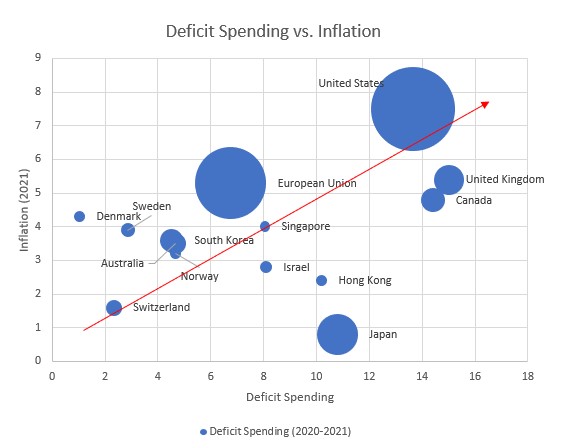
One method is to compare inflation across economies. Not all developed economies effectively printed as much money (or carried out as much deficit spending) as the U.S. Because 2021 spending data is not yet widely available, the following chart includes 2020 spending data combined with the most recent estimates of 2021 data. Inflation data is from 2021. All countries with a GDP over 300 billion and per-capita GDP over $20,000 are included in an effort to capture major and wealthy (and thus comparable) economies. Because it is a monetary exercise, all euro-using EU countries were batched together.

As we can see, with the exception of Japan and its permanently low inflation, there does indeed seem to be a correlation between spending and inflation. In other words, countries that had lower deficits (and thus less monetary pumping) had lower inflation. This is not the whole story, but it is a major contributing factor. Effectively, the currencies of these countries have been devalued vs. those of other nations. This perspective aligns well with the recent news that rent, fuel, and groceries – items more domestic in their sourcing – have seen the greatest levels of inflation.
In summary: the current inflationary beast has at least one monetary parent.
Perhaps the insistence on repeating the phrase “due to surging demand and supply chain constraints” reveals weakness and uncertainty – rather than confidence and truth.


Good stuff.
Good insight.