

Image Source: Pexels
CEA Chair Miran asserts that some of the surprise in the employment numbers is due issues of seasonality. Can we see that? I can’t…
Here’s y/y growth rate of the official series and the seasonally adjusted series.
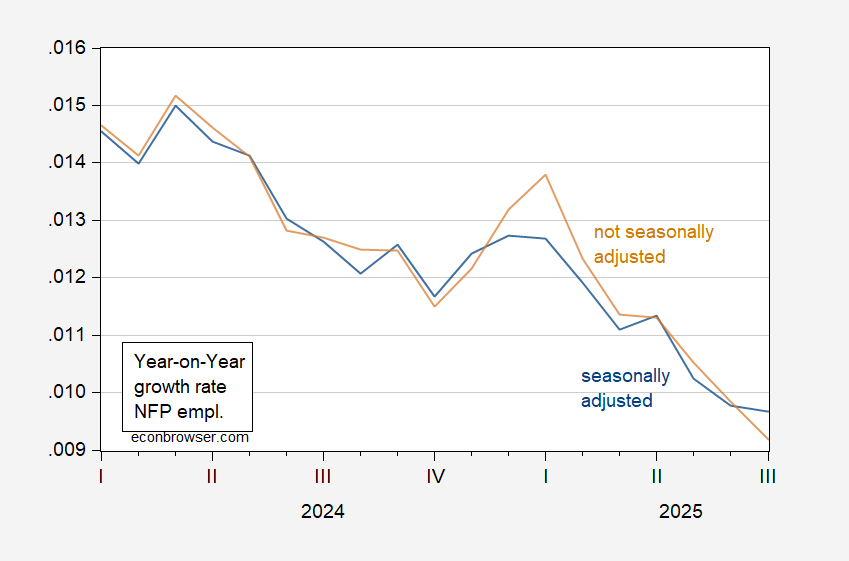
Figure 1: Year-on-year growth rate in seasonally adjusted NFP (blue), and in not seasonally adjusted NFP (tan). Growth rates calculated using log differences. Source: BLS via FRED, and author’s calculations.
The seasonally adjusted series is actually above the y/y not seasonally adjusted series!
What about the level?
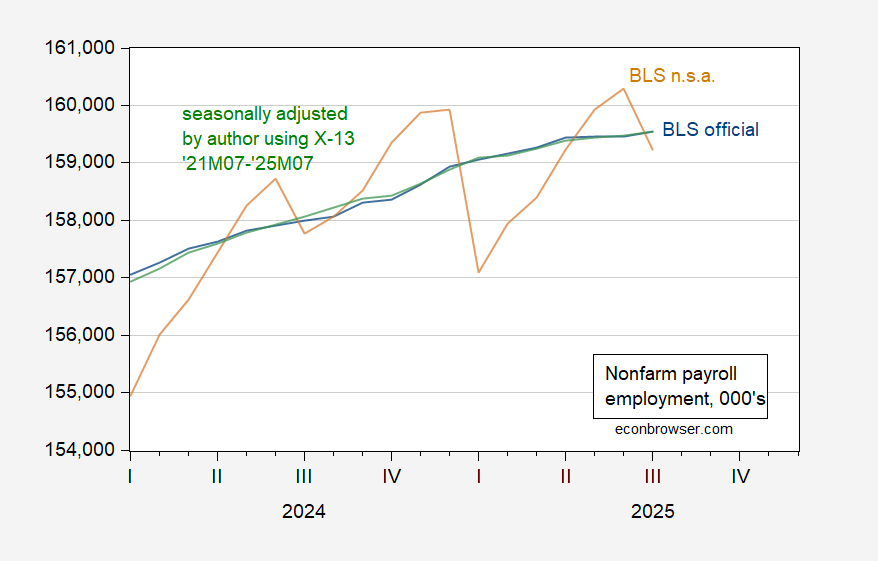
Figure 2: Seasonally adjusted NFP (blue), not seasonally adjusted NFP (tan), not seasonally adjusted NFP adjusted by author using X-13 (in logs, 2021M07-2025M07) (green). Source: BLS via FRED, and author’s calculations.
Another reason to think the BLS numbers have not been “massaged”: the July release numbers better track ADP, on private NFP.
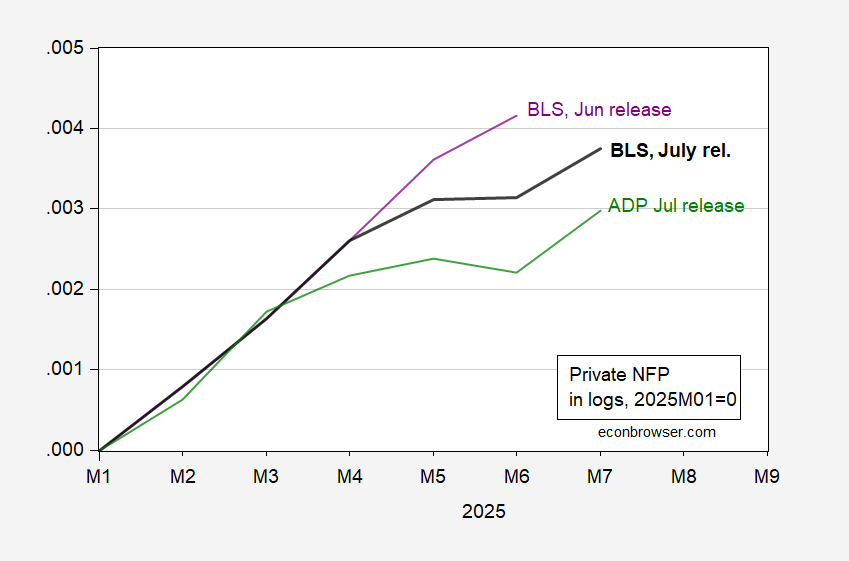
Figure 3: Private nonfarm payroll employment, July release (bold black), Jun release (purple), ADP July release (green), all s.a., in logs, 2025M01=0. Source: BLS, ADP via FRED, and author’s calculations.
In any case, there are usually big NFP misses around turning points. Civilian employment — which is not revised month to month — peaked in April.
More By This Author:
August 1, 2025: A Day That Will Live In Statistical InfamyDownside Surprise In Employment Levels
Trade Policy Uncertainty On The Eve


Comments
Log in or sign up to join the conversation.