
Image Source: Pexels
After years of disappointing returns, hedge funds had somewhat of a renaissance last year. The HFRI Fund Weighted Composite posted a gain of 9.75% for 2024, the best annual return in roughly a decade. And as we all know, investor dollars usually chase returns. HFR also reported that 2024 was the first year of net inflows since 2021. However, for many investors, this may be a case of too little too late. A recent article in the Financial Times looked at the gains the hedge fund industry has generated since it’s inception.
According to research compiled by LCH Investments, since 1960, hedge funds had generated gross returns of approximately $3.7 trillion cumulatively for their investors. Unfortunately, after fees, expenses, and carried interest – which totaled around $1.8 trillion over the period – limited partners were left with just $1.9 trillion of those gains, slightly more than half. For many limited partners, this doesn’t seem like such a great deal – giving up 50% of all gains in exchange for what has been relatively meager overall nominal returns. Consider that the same HFRI hedge fund index has posted annualized returns of just 5.26% over the last decade. A simple 60/40 mix of stocks and bonds would have generated a return of roughly 15% last year, and 6.9% over the same preceding ten-year period. Not only does that handily beat the hedge funds over both periods, but anyone can just go out and buy the IVV and AGG, and for about 3 basis points as well. Simple and cheap.
Many GPs will of course counter that their strategy is special, and their returns are differentiated. They will try to show that the majority of their returns have been alpha, which of course presents its own set of challenges to the researcher. If the GP is using a mis-specified beta (i.e., cherry-picking an easy to beat index), the alpha will be overestimated. But let’s say a given hedge fund manager does generate true alpha. Traditional measures of alpha don’t help evaluate whether the net alpha retained by the LPs after the GPs take their cut is worth it or not.
This is where the net alpha retention ratio comes in. The net alpha retention ratio is just a tool that can be used to measure the vig – the house cut – versus what investors get to take home. When combined with the net retention ratio, it allows an investor to compare alpha to beta to fees to determine if a return stream is worth purchasing. But first, let’s revisit how to calculate alpha, specifically, Jensen’s’ alpha. Jensen’s alpha is the manager’s return minus the risk-free rate plus the product of the beta of the manager with the market times the market premium (or the market return minus the risk-free rate of return):
Alpha = R(i) - (R(f) + B x (R(m) - R(f)))
Let’s assume we have a manager that has generated a gross return of 10% over the last ten years and has a beta to the market of 0.25. Let’s also assume the market has returned just 8% over that time, and the average risk-free rate of return over the evaluation period has been 2.0% (which is about right for ten-year periods). Last but not least, let’s assume this manager has a 1% management fee and 20% profit share. This manager would have not only produced strong nominal returns of 10%, but a gross Jensen’s alpha of 6.5%. Unfortunately, limited partners don’t get the gross alpha. After the 1% management fee leaves 9%, and after the carried interest takes another 1.8% (20% * 9%), the net return winds up at 7.2%. Calculating a Jensen’s alpha from that return yields a net alpha of 3.7% that limited partners would be left with.
Figure 1 – Summary Return Table
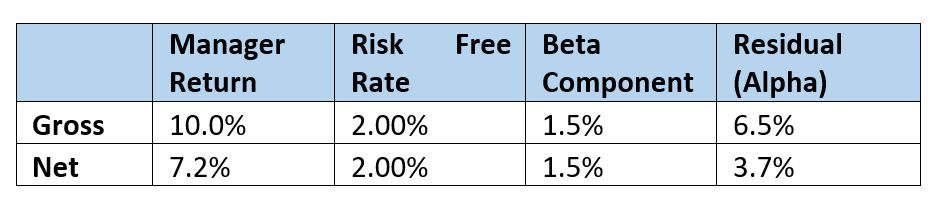
Calculating alpha based on both the gross and net returns allows us to determine the net alpha retention ratio. Since beta is almost free at this point (as mentioned, about 0.03% or so), the fees associated with it can largely be ignored. In the example above, the GP took 2.8% in total fees between management fees and carry – the difference between the gross and net return.
However, since gross alpha was 6.5%, these fees – nearly 100 times the cost of beta! – should be applied against the gross alpha. Meaning, the GP took 2.8% of the alpha and the LP retained 3.7% - which is both the Jensen’s alpha calculated from the net return and the difference between the gross alpha minus the fees. (Note: sometimes the net return profile will have a slightly higher or lower beta because carried interest is not charged linearly, and there could be differences between the two calculations to arrive at slightly differing net alphas). In this case, the net alpha retention ratio would be roughly 57% (3.7% / 6.5%), which shows limited partners kept more than half of the alpha, not merely half the total returns. The net retention ratio – another metric investors should measure – is simply the net return divided by the gross return, or 72%. Compared with the broader hedge fund industry net retention ratio of 51% or so – according to the LCH calculations – this fund is probably worth it.
Historically, I’ve used a rule of thumb to never invest in a hedge fund unless I get to keep 70% or more of the gross return and 50% or more of the net alpha. Otherwise, I don’t think the fees are justified. Of course, one might be willing to accept slightly lower ratios on both for a much higher overall nominal return, or to demand higher ratios for a significantly lower total net return profile, but by remaining disciplined to requiring meaningful net of fee splits on both metrics, you can avoid paying alpha fees for levered beta, or worse.
Lastly, much like alpha itself, variability in beta returns and the risk-free rate can cause wide variance in the net retention rate and net alpha retention ratio. Obviously, a higher beta coefficient or higher return in the beta index leaves less room for alpha. And the less alpha there is to begin, the less there is leftover for investors after fees.
Figure 2 – Net Alpha Retention Ratio, comparing Gross returns across Risk-Free Rates
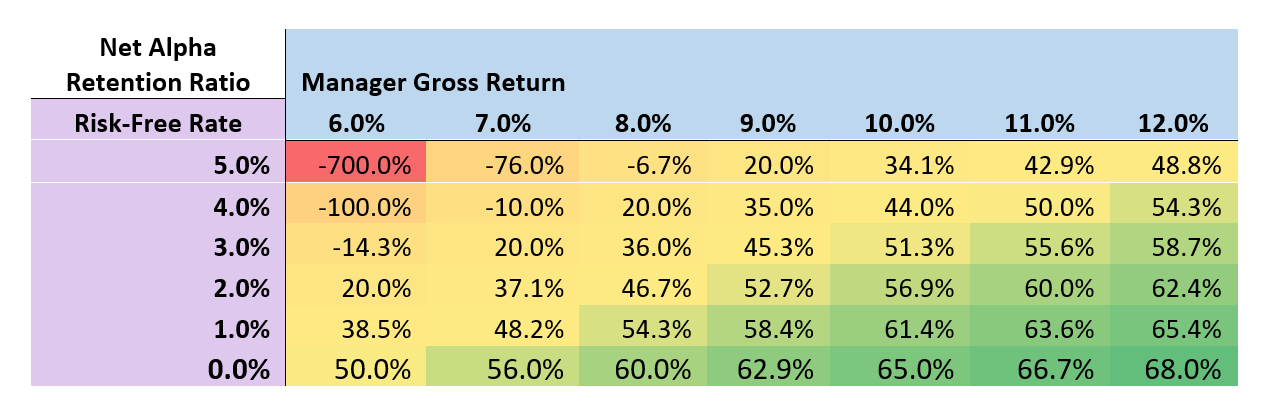
However, changes in the risk-free rate also impact alpha and alpha retention ratios. The same manager profile above yields a 57% net alpha retention ratio when the risk-free rate was 2.0%, but when it rises to 4.0%, that drops to a 44% retention rate. The higher cost of cash is effectively an increased capital charge, and it means that all else being equal, investors should demand higher gross returns or work to negotiate lower fees. Net alpha retention provides an objective framework to do so.
More By This Author:
This Isn’t the Performance You’re Looking For
How DeepSeek Could Change The Future Of AI
Sustainable Investment Outcomes: Perception vs. Reality


Comments
Log in or sign up to join the conversation.