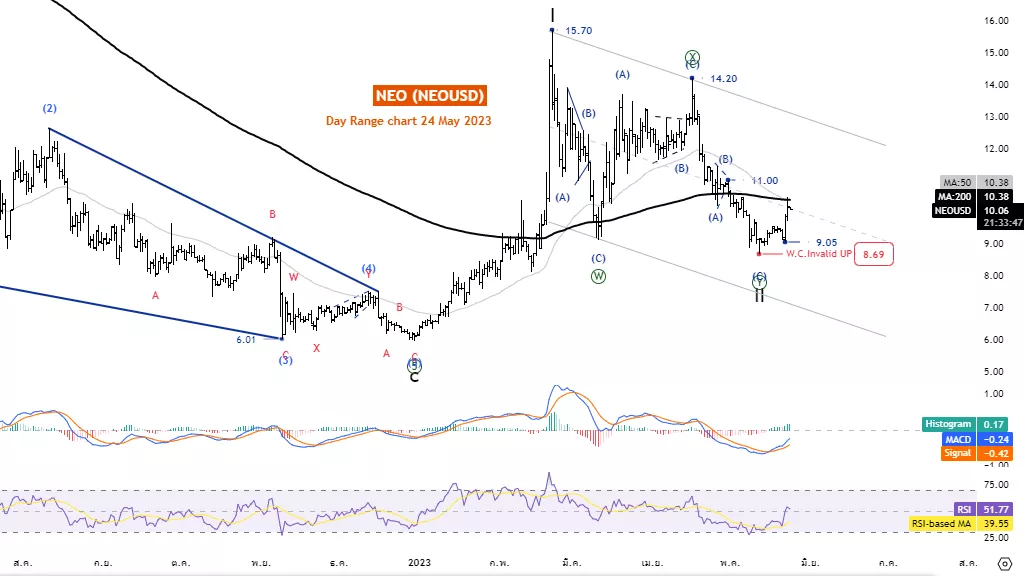
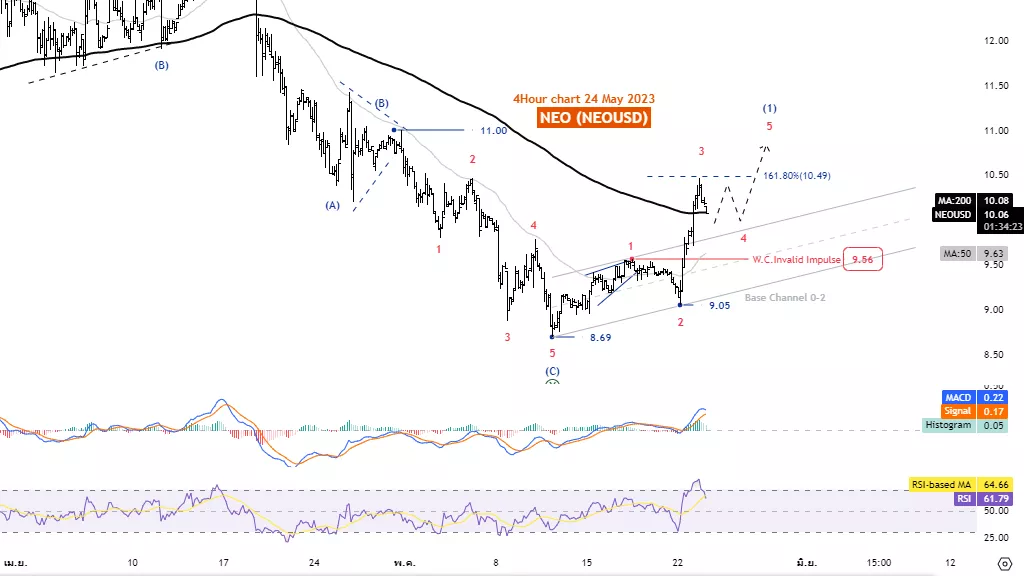
NEOUSD Elliott Wave Technical Analysis - Wednesday, May 24
NEO /U.S.dollar (NEOUSD) Elliott Wave Technical Analysis
Day range
Function: Reactionary(Counter Trend)
Mode: Corrective
Structure: Double Corrective
Position: Wave ((Y))
Direction Next higher Degrees: Wave II of Motive
Details: Wave reversal II has a probability of .786 x length Wave I
Wave Cancel invalid Level: 5.96
NEOUSD Trading Strategy: It is possible that wave ((2)) may end at the level of 8.69. A five-wave rise and a breakout of the 28338.31 level will support this idea. But even so, the price is still in a downtrend as it holds below the MA200, trading is still cautious.
NEOUSD Technical Indicators: The price is below the MA200, indicating a downtrend MACD and RSI are Bullish momentum.

NEOUSD Elliott Wave Technical Analysis
4H Chart
Function: Reactionary(Counter Trend)
Mode: Follow Trend
Structure: Motive
Position: Wave 4
Direction Next higher Degrees: Wave (1) of Motive
Details: Correction in wave 4, when finished, price will rise again in wave 5.
Wave Cancel invalid Level: 9.56
NEO /U.S.dollar (NEOUSD) Trading Strategy: Correction in wave 4, when finished, the price will rise again in wave 5. But the price must not enter the territory of wave 1. Overall, it is still the first phase of an uptrend. which may be corrected again.
NEOUSD Technical Indicators: The price is above the MA200 indicating an uptrend MACD and RSI are bullish momentum.

More By This Author:
Elliott Wave Technical Analysis: DexCom Inc. - Tuesday, May 23
Commodity Markets - Elliott Wave Analysis
Elliott Wave Technical Analysis: Coinbase Global Inc.
Analyst Peter Mathers TradingLounge™ Australian Financial Services Licence - AFSL 317817


