
Photo by Maxim Hopman on Unsplash
Coinbase Global Inc., Elliott Wave Technical Analysis
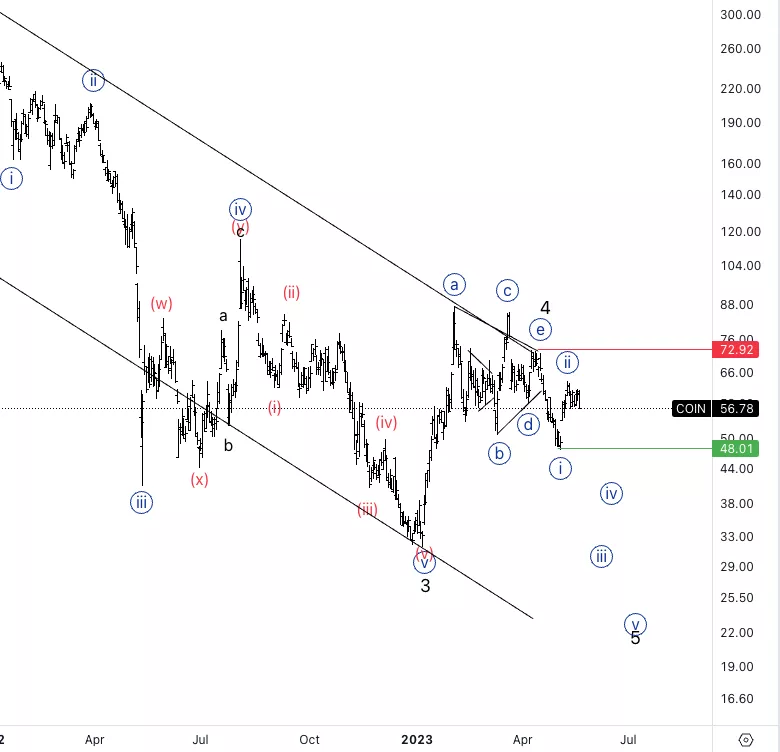
Coinbase Global Inc., (Nasdaq: COIN): Daily Chart, 22 May 2023.
COIN Stock Market Analysis: Looking for further downside into wave {iii} as we have successfully completed the triangle in wave 4 and we seem to have started moving lower into wave 5.
COIN Elliott Wave Count: Wave {ii} of 5.
COIN Technical Indicators: 20EMA as resistance.
COIN Trading Strategy: Looking for further downside to unfold soon, wave count invalidation is a break north of $72.9.
Analyst: Alessio Barretta
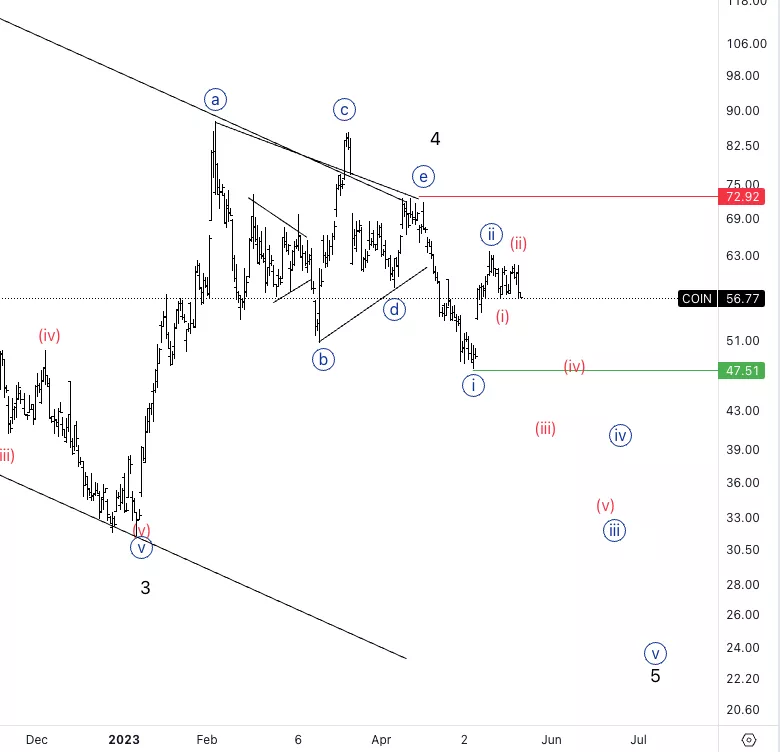
Coinbase Global Inc., COIN: 4-hour Chart, 22 May 2023.
Coinbase Global Inc., Elliott Wave Technical Analysis
COIN Stock Market Analysis: Looking for a downside into wave (iii) of {iii} therefore I do expect an acceleration lower. If not, then we can start thinking either wave {ii} is not finished or else the whole count is compromised.
COIN Elliott Wave count: Wave (iii) of {iii}
COIN Technical Indicators: 200EMA as resistance.
COIN Trading Strategy: Looking for downside into wave (iii).
More By This Author:
Elliott Wave Technical Analysis: Theta Token - May 22
Elliott Wave Analysis: SP500 | NASDAQ | Russell 2000 | Dow Jones
CrowdStrike Inc.(CRWD) Elliott Wave Technical Analysis 19 May 23


Comments
Log in or sign up to join the conversation.