
Gold's Direction: The State Of The Trend Vs. The Waves
If you pay much attention to the wave analysis, Fibonacci, Elliot, what have you, the next significant move in gold is surely down to $1150ish. You can sample some of what these types are saying now here, here, and here. I am a kindred spirit with the wave people in that I am mostly a technical analyst. The chicken scratching means all the world to me. But the Fib levels and other cycling methods usually don't interest me much. But when there seems to be a lot of these practitioners saying the same thing - well, you ignore them at your own peril.
There seems to be a difference of opinion now on gold between trend analysis and the wave counting. I have found that one of the most consistent means of looking at the health of a trend is simply by moving averages. Of course you've probably heard of the "golden cross" or "death cross" when there is a crossing of the 50 day moving average with the 200 day, either up or down. But one good way of seeing if a trend is intact or changing is by looking at what I call MAPS - Moving Average Pair Support. This is the 140 day ema (exponential moving average) compared with the 200 day ema. It is the best divider I know of between a bear and a bull market.
Major market averages typically obey the MAPS division pretty well, but gold in particular obeys it very consistently. Let's look at how gold has behaved in its bull/bear transitions since the late '90s by viewing them with MAPS: (click on images to enlarge)

Here we see that the moving average pair was down-sloping and acting as resistance in the bear market, then a violent breaking out above MAPS followed by a cross between the moving averages. From then on, MAPS acted very consistently as support in the new bull market. There was something of a breakdown of this in early 2003 as the MAPS slope switched to negative and gold went well below this negative slope. But if you will recall, there was a lot of unusual stuff going on in the world at the time. The US was getting ready to invade Iraq, which we thought was chock full of bio-weapons, and gold went on a tear, bending the moving averages sharply up. Then the war was quickly won, and gold overshot a bent MAPS to the downside.
The second bear/bull transition was 2009:

The Financial Crisis of 2008 put gold into a one year decline. This changed with a MAPS cross, after which the MAPS support was consistently obeyed for years. Which brings us to the present:

MAPS has switched from resistance in the four year bear market, to a cross, and now to support in a new bull. If past MAPS behavior is any guide, the persistent obedience gold has with it has begun a new chapter and the severe bounce we saw on Friday smack on the MAPS bound will probably wind its way up to new post cross highs. The cycling move to the mid $1100s would be well below MAPS, hence the difference of opinion between the state of the trend and the cycling.
If gold does in fact go to around $1150, the cycles have it there for just a month or less before flying back into the bull climb. So is it worth trying to trade a portfolio around this short term movement? That depends on your commissions, taxes, your tolerance for aggravation, and whether you own mostly gold or the miners. If you have a line up of quality miners (not ETFs) they can be more independent of the short term gold price than you may think, being moved by positive company developments while you have them traded to the sidelines timing a gold price blip:
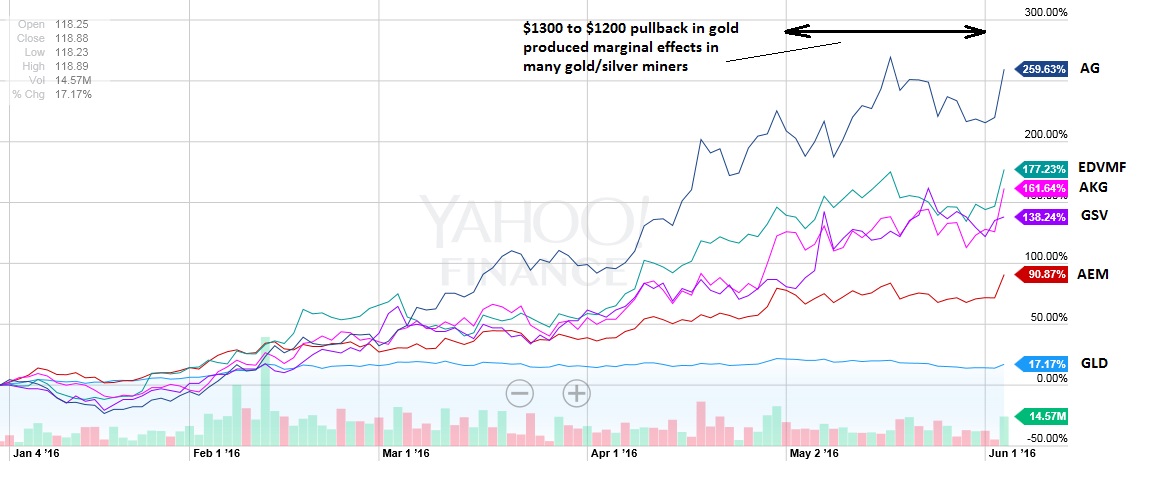
As this chart shows, over the month of May, we saw a $100 move down in gold, but trying to trade a gold miner portfolio around this would have been very dicey. So if we go another $50 down to the $1150 level, will that trading turn out any better? Maybe, who knows. The miners, especially South Africans, led the turn at the start of the year, and they seem to be strongly leading now. It may be advisable to just watch gold's behavior on this bounce off MAPS, and if it clearly weakens below it, maybe take some profits here and there.
I am long AEM, GSV, AKG, EDVMF, AG


Quoting you: "I am a kindred spirit with the wave people in that I am mostly a technical analyst" So given the choice between technical analysis and non technical analysis, which do you prefer? In my opinion, charts are helpful in illustrating historical patterns but alone they can't predict whats going to happen in the future obviously. In other words chart analysis is theory and helpful. We also need to carefully follow major events like wars, recessions, presidential changes, and rate hikes and see what effect they have on Gold and the dollar index. The next huge event is going to be the Brexit vote in the UK later this month. Many are saying if the UK votes in favor of Brexit, gold prices will shoot up. Have we seen this type of effect in the past with other countries' currencies? Is global confidence in gold merely a fad? Would love to hear your thoughts?
Everybody loves to hate the chicken scratching study (chart reading) and you have to have some faith in the efficient market theory to not feel silly doing it. I also have some faith in fundamental analyses, and cash flow and revenue value and patterns enter into my thinking. But honestly, I feel that fundamental screens, and looking for good vs bad areas of the market just provide a universe of buys that improve your odds with technical analyses.
The efficient market theory forces you to admit that, no matter how much you read and know, the market is a composite of more reading and knowing than any one person can muster. Of course, any idiot can digest facts and come up with a buy/sell opinion. But consider this. A mindless, well informed idiot making a trade is just as likely to be wrong bearish or bullish - its a coin flip since he's an idiot. Well, thousands of coin flips cancel each other out, and what you have left is just the well thought out conclusions with more good minds and information than you or I can accomplish on our own!
The result of all this thought and buy/sell action is right there on your chart. You have to respect it. I look more at trends than valuation or reactions to headlines. You can disagree on the market's valuations or headline knee-jerk moves. But a trend will more consistently show you the future and is the result of all the market's work for you.
Maybe Buffett summed it all up best:
"You shouldn’t try to time the market....it’s a mistake to predict or listen to others who predict the short-term movement of stocks.....don't try to flip stocks like high-frequency traders do.
The best thing the average investor can do is buy an index fund over time. That’s it.
The click to enlarge feature isn't working on the charts. After Monday night, I will have this article at Good Stock Investing and you can view the enlarged charts there.