
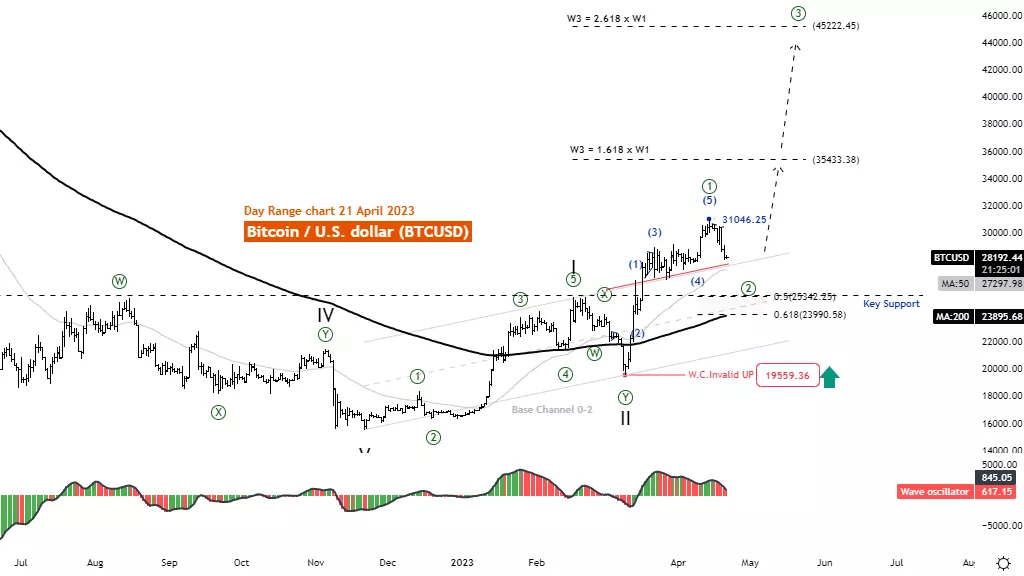
Elliott Wave Analysis Daily Chart, April 21, 2023
Bitcoin /U.S.dollar (BTCUSD)
Function: Follow trend
Mode: Motive
Structure: Impulse
Position: Wave III
Direction Next higher Degrees: wave (I) of Motive
Details: Wave 3 is equal to 1.618 or 2.618 multiplied Length of wave 1
Wave Cancel invalid level: 15479
Bitcoin /U.S.dollar(BTCUSD)Trading Strategy: The second wave retracement tends to be .50 or .618 of the first wave length. Therefore, there is an important support level in the area of 25342 - 23990.
Bitcoin /U.S.dollar(BTCUSD)Technical Indicators: The price is above the MA200 indicating an UpTrend The wave oscillators above Zero-Line momentum are Bullish.
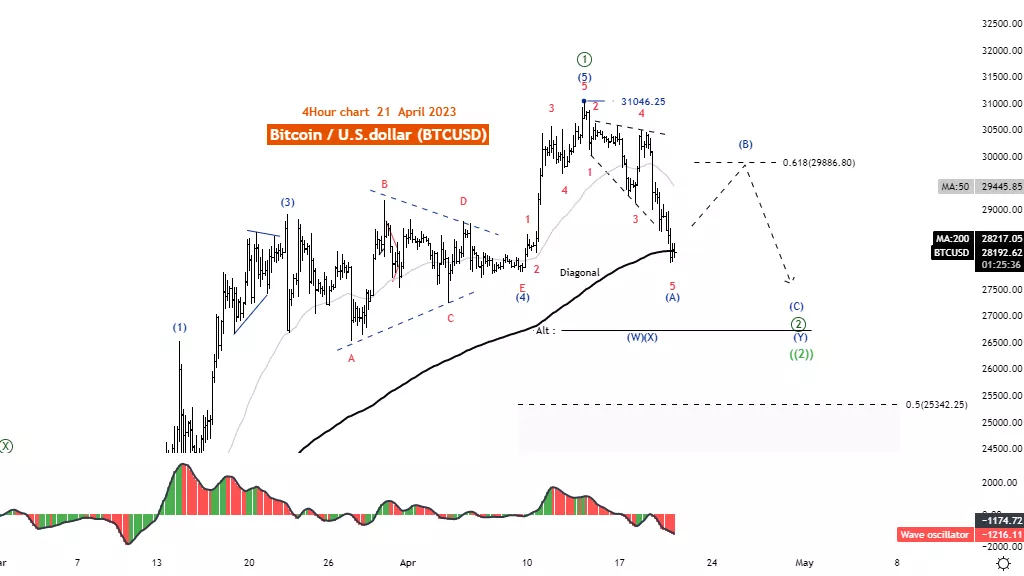
Elliott Wave Analysis 4H Chart, April 21
Bitcoin /U.S.dollar (BTCUSD)
Function: Reactionary(Counter Trend)
Mode: Corrective
Structure: Zigzag
Position: Wave (A)
Direction Next higher Degrees: wave ((2)) of Motive
Details: Retracement of wave ((2)) usually .50 or .618 x Length wave ((1))
Wave Cancel invalid level:
Bitcoin /U.S.dollar(BTCUSD)Trading Strategy: The decline of the first corrective wave extends into five waves in an Expanding Diagonal pattern, leading us to expect a zigzag correction and a short-term pullback of wave (B) and a further decline in zigzag. waves (C).
Bitcoin /U.S.dollar(BTCUSD) Technical Indicators: The price is above the MA200 indicating an UpTrend The wave oscillators below Zero-Line momentum are bearish.
More By This Author:
Elliott Wave Technical Analysis: Phreesia Inc. - Thursday, April 20
Elliott Wave Technical Analysis: Dogecoin/U.S. Dollar
Elliott Wave Analysis: U.S. Stocks


Comments
Log in or sign up to join the conversation.